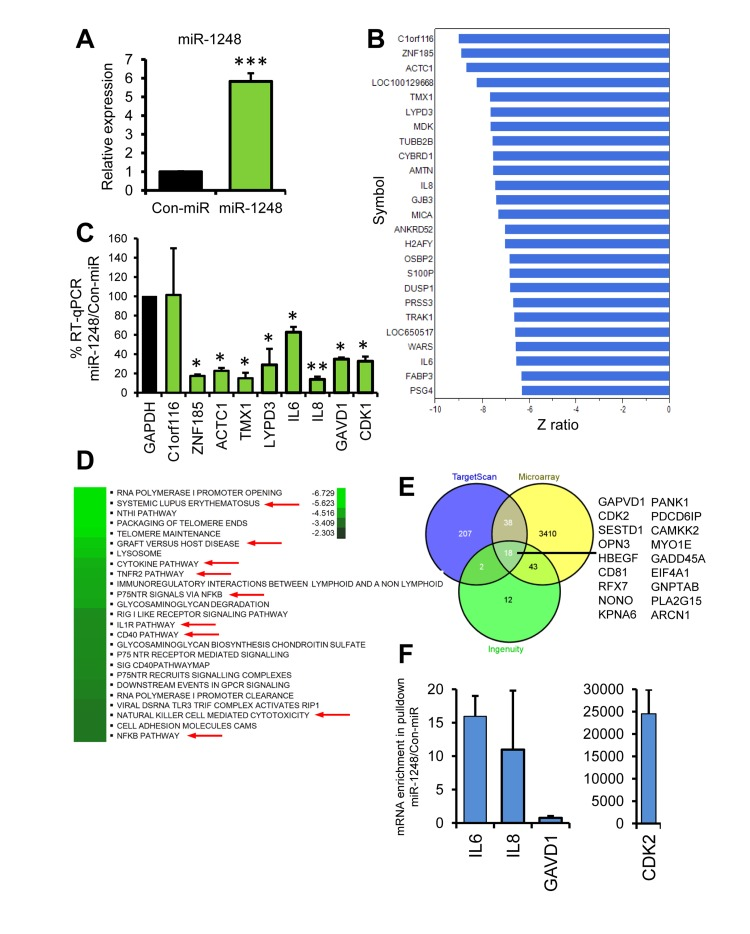
Figure 6.Pathway and Target analysis for miR-1248(A) HeLa cells transfected with Con-miR or miR-1248 were analyzed 48 hrs after transfection for miR-1248 expression using real-time RT-PCR. Data was normalized to U6 expression and the histogram represents the mean + SEM from 3 different experiments. (B) Total RNA from (A) was analyzed using genome-wide Illumina microarrays. The top downregulated genes are listed and the corresponding numerical complete dataset is presented in Suppl. Table S1. (C) RT-qPCR validation of microarray results using mRNA-specific primer pairs. (D) Top canonical pathways for genes downregulated by miR-1248 overexpression are shown on the heatmap. Red arrows indicate inflammatory and cytokine pathways. (E) Venn diagram of putative targets from TargetScan, Ingenuity and miR-1248 microarray analysis. Overlapping mRNAs are listed. (F Biotinylated miR-1248 or Con-miR were transfected into HeLa cells and were precipitated using streptavidin beads. Associated mRNAs were isolated and gene-specific primers were used for RT-qPCR.