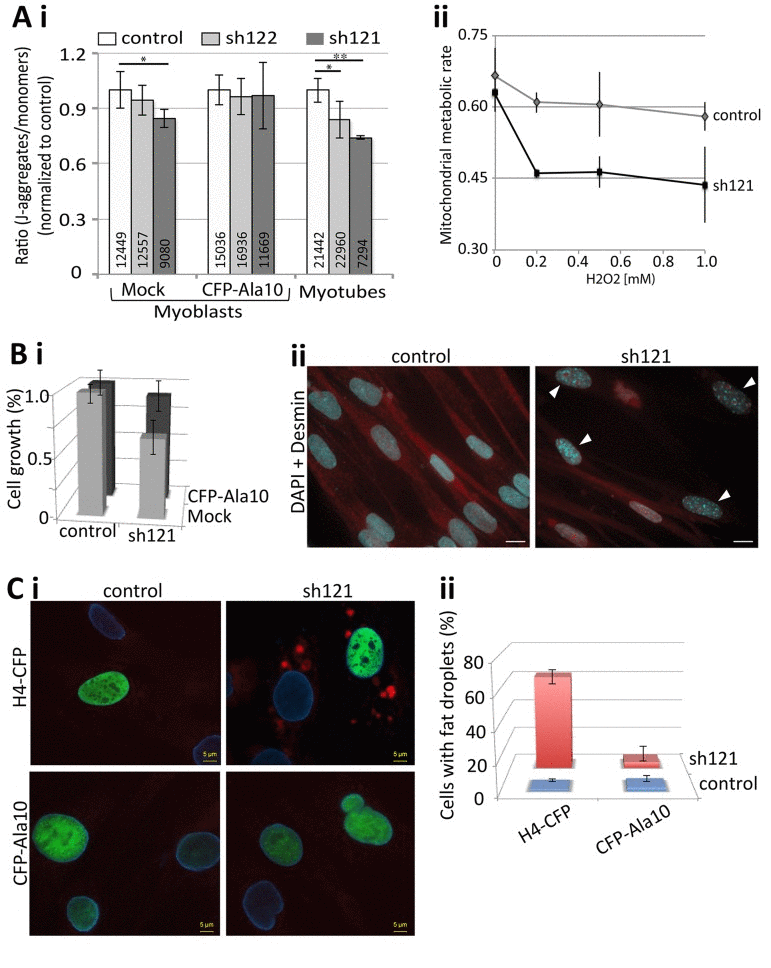
Figure 7.PABPN1-DR induces cellular aging in muscle cells(A) PABPN1-down regulation induces a decrease in mitochondrial metabolic rate. (i) Bar chart shows the ratio of J-aggregates to monomers in JC-1-labeled myoblasts or myotube cultures. Cell cultures are of control (7304) or PABPN1-DR (sh122 and sh121) cultures, before (mock) or after transducion with CFP-PABPN1 lentivirus particles. Averages and SD are from six replicates, and the number of cells per sample is indicated within each bar. Significant effect in PABPN1-DR from control cultures (P<0.05 or P<0.005) is indicated with one or two asterisks, respectively. (ii) Plot shows the ratio of J-aggregates to monomers in JC-1-labeled cultures after 1 hour H2O2, in concentrations as indicated in the chart. Averages and SD are from three replicates. (B) A decrease in cell growth is caused by PABPN1-down regulation. (i) Bar chart shows cell growth (24 hours) in control (7304) and PABPN1-DR (sh121) cultures, before (mock) or after transduction with CFP-PABPN1 lentivirus particles. Averages and SD are from three replicates. (ii) Heterochromatic foci are formed in PABPN1-DR cells. Heterochromatic foci are visualized with DAPI (indicated with arrowheads), cells are visualized with Desmin. Scale bar is 20 μm.