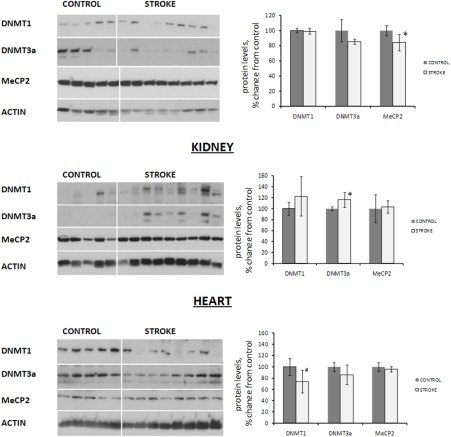
Figure 3.Expression of DNA methyltransferases and methyl-binding protein MeCP2 in liver, heart and kidney tissues of control and stroked ratsProtein levels relative to those of control animals are shown as the mean ± SD, ±significant, p < 0.05, Student's t-test. Representative blots from among three independent repeats are shown.