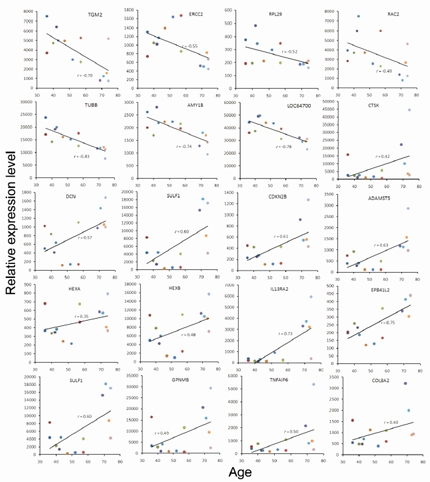
Figure 2.Representative plots of donor age versus normalized mRNA expression level for selective age-associated genes.Each solid dot represented a bone marrow donor. The regression lines (solid line) and correlation coefficients (r) showed trend of change in gene expression with increasing donor age. Donors are color-coded as shown in Table I.