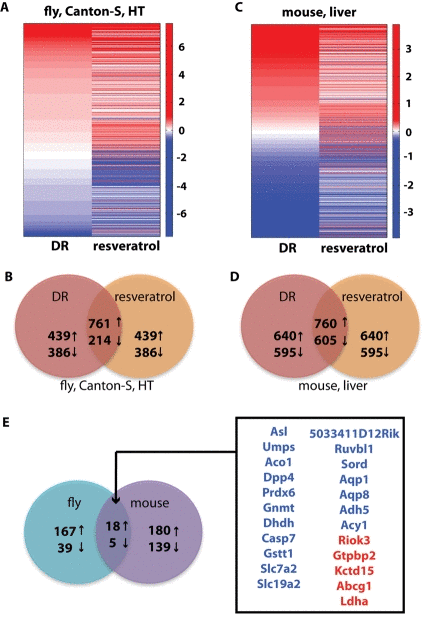
Figure 3.Comparison of dietary restriction and resveratrol treatment in fruit fly and mouse. (A) Heat map of the fold-changes of the genes selected by the list comparison algorithm in either the DR or resveratrol dataset in the head-thorax (HT) of Canton-S female fruit flies. (B) The Venn diagram of the genes selected in the comparison between DR and resveratrol in the fly dataset shows a significant intersection of 975 genes. (C) Heat map of the fold-changes of the genes selected by the list comparison algorithm in either the DR or resveratrol dataset in the mouse liver dataset from Pearson et al. [17]. (D) The Venn diagram of the genes selected in the comparison between DR and resveratrol in the mouse liver dataset shows a significant intersection of 1,365 genes. (E) Venn diagram of the comparison between the DR/resveratrol signature in fly and mouse. The 23 genes in common are listed and color-coded in blue (up-regulated) and red (down-regulated). The 229 fly genes and 342 mouse genes used in this comparison were selected out of the 975 and 1,365 respectively as having a homolog gene in the other species.