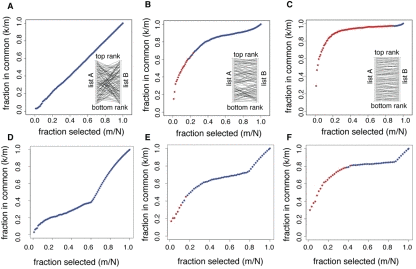
Figure 1.Statistical significance of the overlap between gene lists. Each panel shows the fraction of genes in common between two lists of genes (k/m) as a function of the fraction of genes selected in each list (m/N). The overlaps selected as statistically significant by the list comparison algorithm are marked in red. The top three panels correspond to simulated data, with the inlets representing how list A of genes was shuffled to generate list B. (A) The two lists are completely unrelated: list A was randomly shuffled to generate list B. (B) The two lists are partially related: list A was shuffled with a constrain on the number of ranks a gene could jump to. (C) The two lists are strongly related: same shuffling as in (B), with a stricter constrain. The bottom three panels correspond to list comparisons from datasets in Bauer et al. [6]. (D) The algorithm did not detect any significant overlap when applied to genes up-regulated when Dmp53 activity is diminished in D. melanogaster, and up-regulated genes in the yw, w1118 strain with respect to the Canton-S strain used. (E) The algorithm detected a significant overlap between up-regulated genes in the DR and Sir2 datasets. (F) The algorithm detected a large overlap between DR in two different fly strains (yw, w1118 and Canton-S).