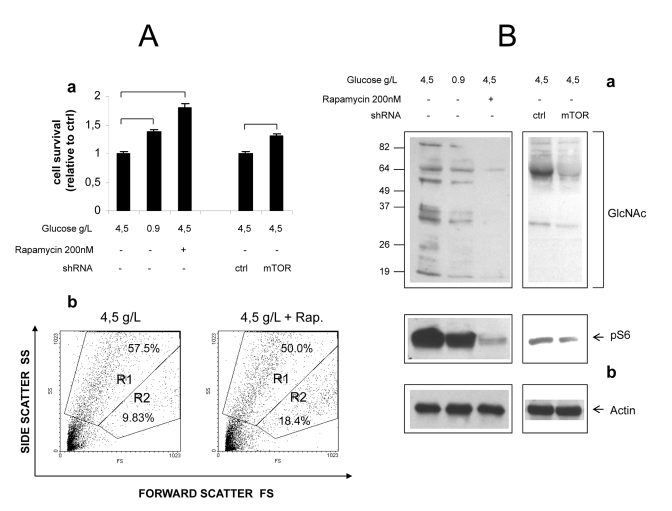
Figure 6. Role of mTOR in
hyperglycemic damage of HUVEC cells. (A) a
Effect of glucose, Rapamycin and mTOR knock-down on survival of growth
factor-starved HUVECs. Values are relative to cell survival in high
glucose (10-15% survival). Numbers are
mean± SD of four samples from two independent experiments. All the
indicated comparisons were significant by at least p<0.05 (two-tailed
unpaired T-test). b Representative Forward/Side scatter plots
of live (Region R2) and dead (Region R1) cells under high glucose and high
glucose + Rapamycin. Raw numbers indicate percentages with respect to all
the plotted events, including cell debris. Survivals were calculated on
relevant regions only, according to the formula %survival= %R2/(%R1+%R2). (B)
Western blot analysis of GlcNAcylated proteins in total lysates of HUVEC
cells. Glucose, Rapamycin and mTOR knock-down were combined as indicated.
Impact of treatments on mTOR signaling was evaluated by anti phospho S6
immunoblotting (b). Equal protein loading was verified by
anti-actin staining. Blots representative of two independent experiments.