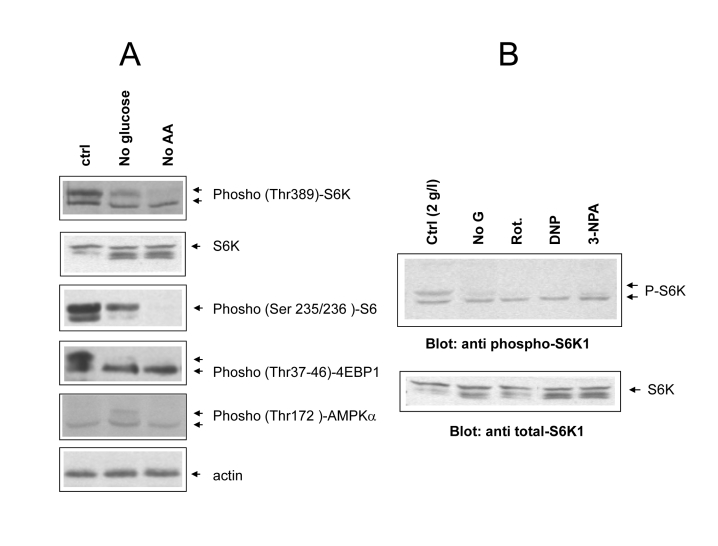
Figure 3. (A)
Phospho-specific immunoblot analysis of mTOR/S6 kinase cascade activity
under different cell feeding conditions. Cells were incubated for 24 hours
in the indicated conditions (ctrl= 2g/l glucose + Aminoacids; noAA=
glutamine and NEAA omitted). Where possible the same filter was cut into
parallel strips and hybridized contemporarily with different antisera. When
molecular weights of target proteins overlapped, filter were stripped and
re-hybridized, or twin filters were prepared with the same protein lysates.
Hyperphosphorylated protein species usually migrate slower and are
indicated by separate arrows. Picture representative of several independent
experiments. (B) Effect of metabolic inhibitors from figure
1B on S6 kinase phosphorylation. Upper arrows indicate the fully
phosphorylated forms. Equal content of total S6 kinase in the different
samples was verified by anti total S6K immunoblotting of the same protein
lysates on a different nitrocellulose membrane. Picture representative of
2-3 three independent experiments.