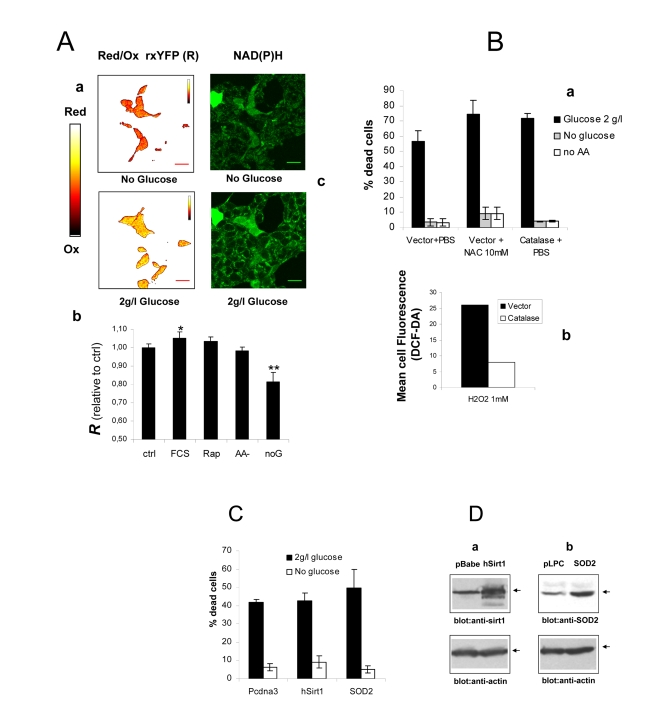
Figure 2. (A) a
Intracellular redox state under nutrient restriction. a
pseudocolor image (color bar on the left) of Phoenix cells
expressing a redox-sensitive variant of the Yellow Fluorescent Protein
(rxYFP) after 24 hours incubation in the absence of glucose (upper) and 30
minutes glucose re-feeding, in serum-free medium. Color shift from red to
yellow indicates reduction of the fluorescent sensor. b
Quantitation of mean R values over several regions of interest is reported.
Data sets were compared by two-tailed t-test for independent samples. c
Microfluorimetric analysis of reduced intracellular reduced NAD(P)H, based
on cell green autofluorescence. Cells were excited in the two-photon mode
at 366 nm and autofluorescence collected between 380 and 550 nm. Increase
in cell brightness in the glucose-fed samples indicates accumulation of
reduced pyridine nucleotides. (B) a Effect of
antioxidants Catalase and N-Acetyl-Cysteine on cell viability in the
presence and absence of glucose. Cells were transfected with a construct
encoding human Catalase or the corresponding empty vector 48 hours before
nutrient and serum starvation. Mock-transfected cells were also treated
with 10 mM NAC as an alternative ROS scavenger. Values are mean±SD of
triplicate wells. The experiment was repeated twice with identical results.
b Cytofluorimetric analysis of cells loaded with the redox
sensitive die H2-DCF-DA and exposed to a bolus (1 mM) of extracellular
Hydrogen Peroxide. Decreased oxidation in the Catalase-transfected samples
confirms elevated H2O2 degrading capacity in these cells. (C) Lack
of effect of the longevity protein Sirt1 and the mitochondrial superoxide
scavenger SOD2 on Phoenix cell viability in the presence of glucose
and under glucose deprivation. Cell
viability was scored at 72 hours after cell starvation. Representative of
two comparable experiments. (D) Western blot analysis of Sirt1 (a)
and SOD2 (b) expression in transfected cells. Transfection
efficiency was normally around 50% based on expression of GFP.