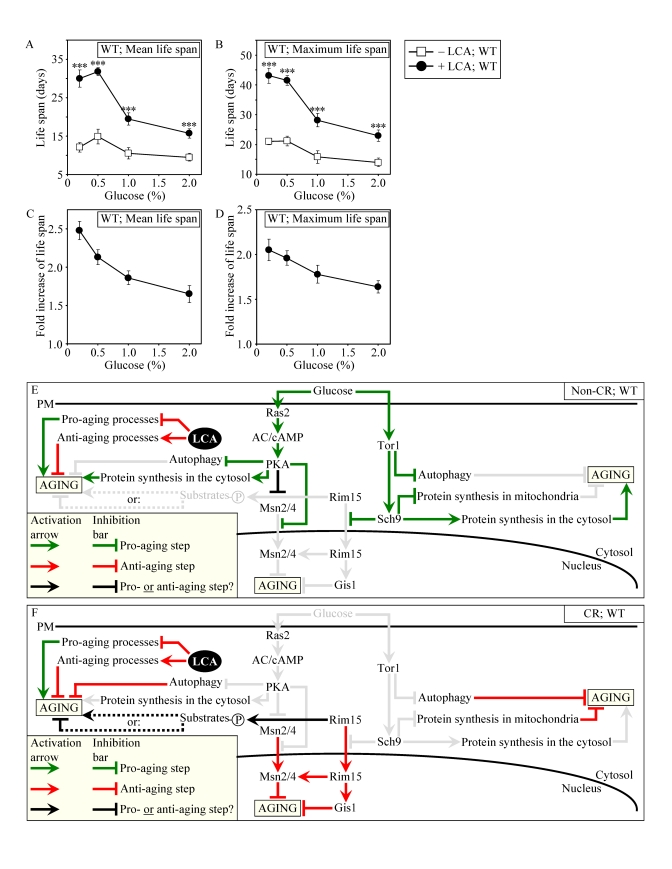
Figure 8.LCA increases the CLS of WT strain to the highest extent under CR conditions. (A and B)
Effect of LCA on the mean (A) and maximum (B) life spans of
chronologically aging WT strain. Data are
presented as means ± SEM (n = 12-28; ***p < 0.001). (C - E) Effect of LCA on the
fold increase in the mean (C) or maximum (D)
life span of chronologically aging WT strain. Data are presented as means ± SEM (n = 12-28). Cells
in A to D were cultured in medium initially containing 0.2%,
0.5%, 1% or 2% glucose in the presence of LCA (50 μM) or in its
absence. Survival data are provided in Supplementary Figure 9. (E
and F) Outline of pro- and anti-aging processes that are controlled
by the TOR and/or cAMP/PKA signaling pathways and are modulated by LCA in
WT cells grown under non-CR (E) or CR (F) conditions.
Activation arrows and inhibition bars denote pro-aging processes (displayed
in green color), anti-aging processes (displayed in red color) or processes
whose role in longevity regulation is presently unknown (displayed in black
color). Doted lines denote hypothetical processes. Abbreviations:
PM, plasma membrane.