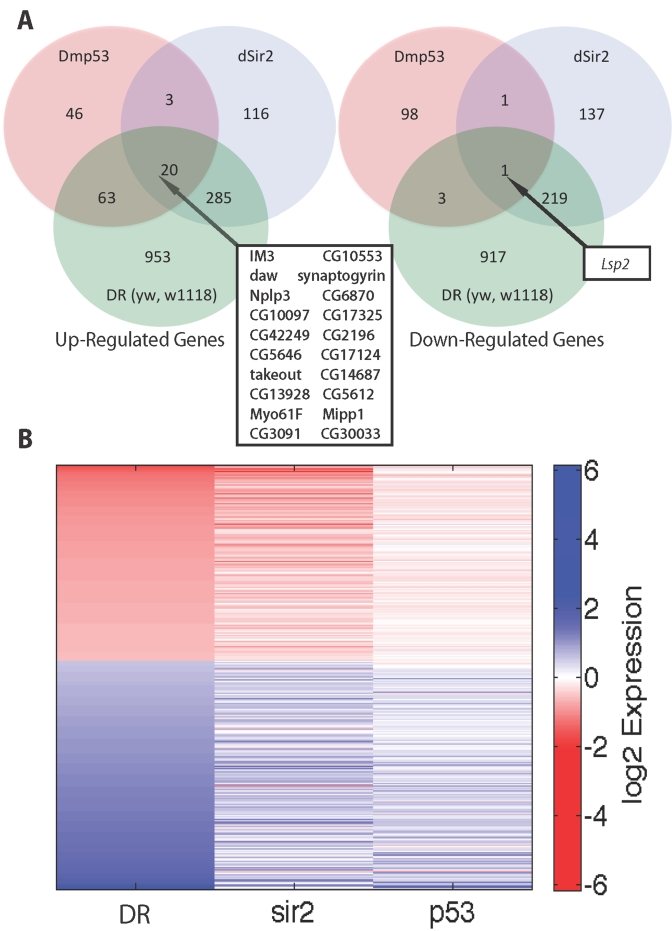
Figure 2.Comparison of genes upregulated and downregulated in DR, dSir2 overexpression and DN-Dmp53 expressing long-lived flies at Day 10. (A)
Venn diagrams comparing upregulated and downregulated genes in DR, dSir2 overexpression,
and DN-Dmp53 in a yw/w1118 background at age 10 Days. Genes intersecting
in all 3 sets are noted in box with arrow. (B) Heatmap comparing the average
log2 fold changes for genes significantly altered in the yw/w1118 DR
with the equivalent genes in dSir2 and DN-Dmp53 expressing flies.