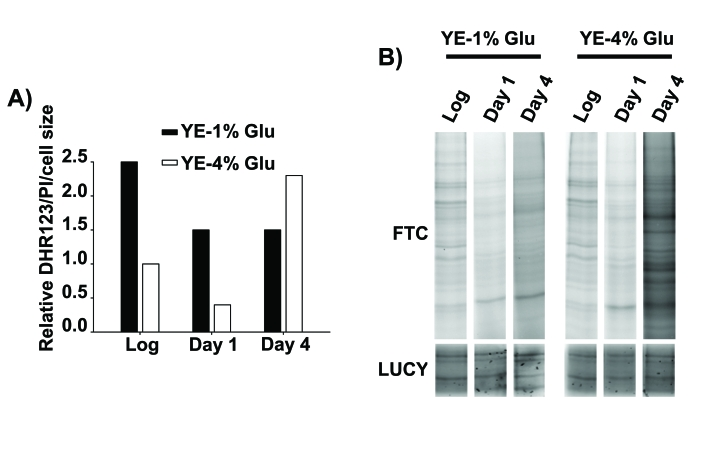
Figure 2.Oxidative stress as a cause of death of stationary phase, glucose-rich cultures.
(A) Relative intracellular H2O2 levels of cells in
logarithmic and stationary phase conditions. Wild type cells were grown in YE-1% and
YE-4% glucose media. At the logarithmic phase (Log) and one or four days after
reaching stationary phase (Day 1 and Day 4) cells were incubated with the redox-sensitive
dye dihydrorhodamine 123 (DHR123) and with the permeability-dependent dye propidium
iodide (PI), and the fluorescence of live cells was analyzed by flow cytometry.
The DHR123 green fluorescence was normalized to the PI red fluorescence and to the
cell size (y axis: Relative DHR123/PI/cell size), and all the values are referred
to that of YE-4% glucose culture in logarithmic phase, with an assigned value of 1.
(B) Protein carbonylation generated during stationary phase in calorie
restriction and rich glucose condition. Cells from the same strains as in A
were collected, protein samples were loaded in a SDS-PAGE gels and protein
carbonylation was detected by fluorescein-5-thiosemicarbazide (Fluka-Sigma)
fluorescence (FTC, top panel). Protein carbonylation detection method was performed
like in [34] with minor modifications. LUCY (Sigma) staining
of total proteins was performed as a loading control (LUCY, bottom panel).