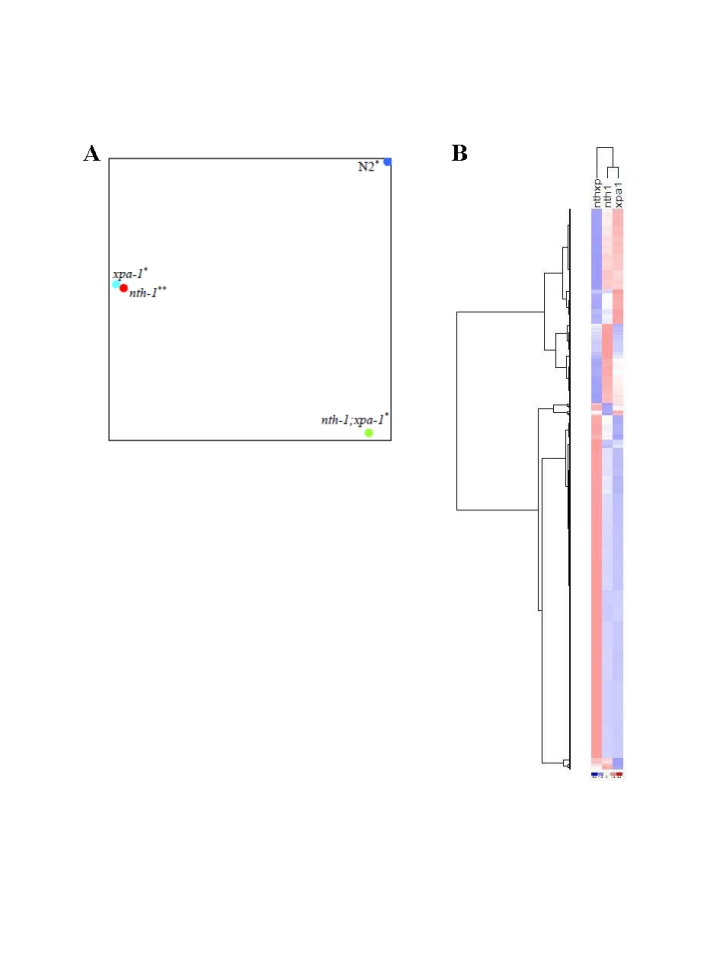
Figure 5.Comparative analyses of transcriptomes in DNA repair mutants. (A) The
distance between respective mutants denoting the similarities or
dissimilarities between nth-1 (red circle), xpa-1 (light blue
circle), nth-1;xpa-1 (green circle) and wild-type (blue circle) is
shown using PCA. (B) Separation of the different mutant sample
groups using Hierachical clustering.