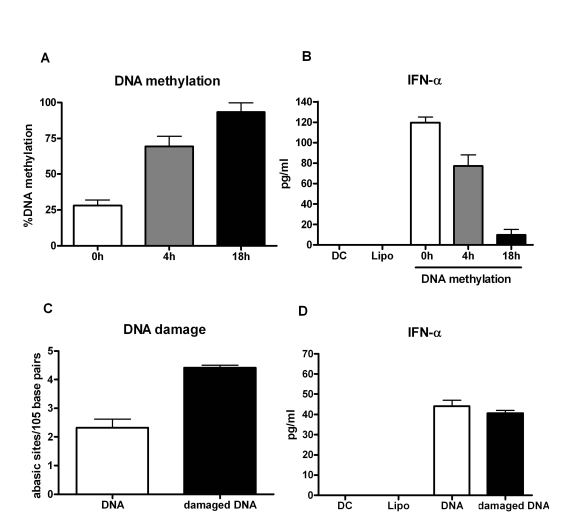
Figure 3.Immunogenicity of mammalian DNA correlates inversely with DNA methylation.
(A) DNA
was methylated using a methyl transferase enzyme and percent global
methylation was measured by ELISA. Bar diagram shows the percent of global
methylation at 0h, 4h and 16h after the reaction. Figure is mean +
S.E. of five separate DNA tested. (B) The immunogenicity of the
methylated DNA was determined by measuring the IFN-α secretion by DCs. Bar diagram
shows the level of IFN-α
secreted by DCs in response to the DNA. Figure is mean +
S.E. of
five separate DNA tested. (C) PBMCs were treated with hydrogen
peroxide to induce DNA damage. Damaged DNA was extracted and the extent of
damage was determined by ELISA. Bar diagram shows the level of DNA damage
before and after treatment. Figure is mean +
S.E. of five separate
DNA tested (D) The immunogenicity of the H2O2
damaged DNA was determined by measuring the IFN-α secretion by DCs. Bar diagram
shows the level of IFN-α
secreted by DCs in response to the DNA. Figure is mean +
S.E. of
five separate DNA tested.