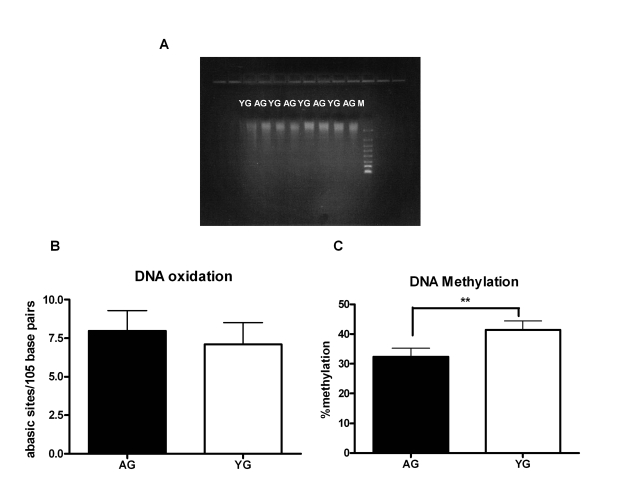
Figure 2.DNA from aged subjects is demethylated compared to DNA from young subjects. (A) FlashGel
showing the molecular weight of Aged and young DNA. Figure is
representative of eight such experiments. (B) Bar diagram
depicting the damage in DNA from aged and young subjects as determined by
ELISA that measures the number of abasic sites per 105 base
pairs. Figure is mean +
S.E. of twenty five separate aged and young
DNA tested. (C) Bar diagram depicts the percent of global
methylation in aged and young DNA as measured by ELISA. The methylated
fraction of DNA is recognized by 5-methylcytosine antibody and quantified
through an ELISA-like reaction. Figure is mean +
S.E. of twenty four
separate aged and young DNA tested.