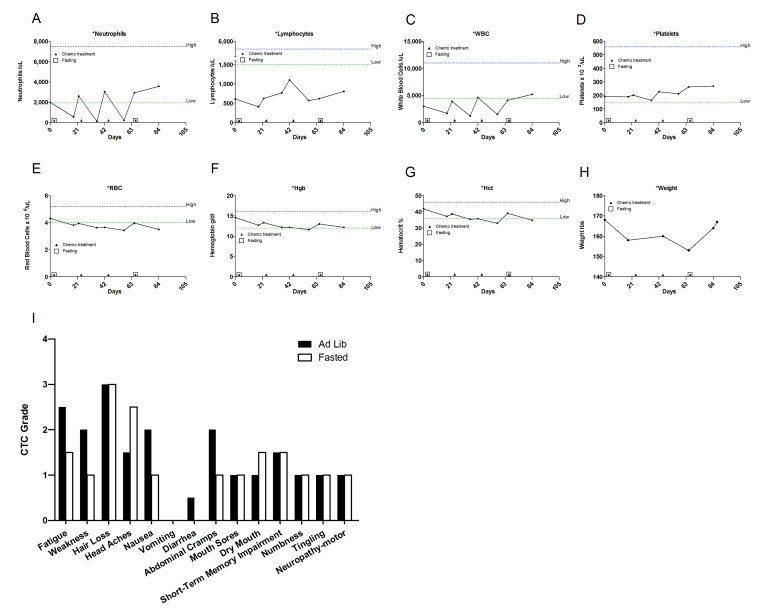
Figure 2.Laboratory values of blood cell counts for case 1. (A)
Neutrophils; (B) Lymphocytes; (C) White blood cells, WBC; (D)
Platelets; (E) Red blood cells, RBC (F) Hemoglobin, Hgb; (G)
Hematocrit, Hct; (H) Body weight. Filled triangle indicates day of
chemotherapy; open square indicates fasting. Normal ranges of laboratory
values are indicate by dash lines; (I) Self-reported side-effects after
chemotherapy for case 1. Data represent the average of 2 cycles of
chemo-alone vs the average of 2 cycles of chemo-fasting treatments.