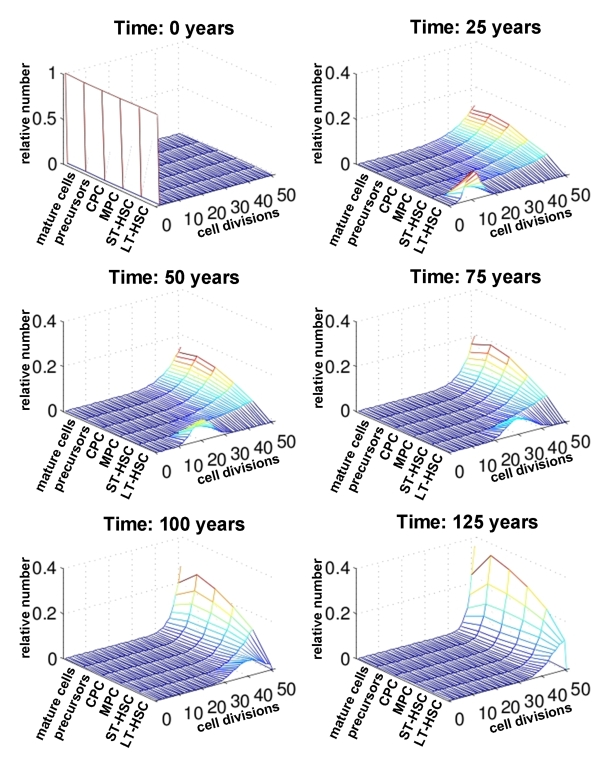
Figure 4.Number of cell divisions over time. For each compartment of differentiation the relative number of cells is plotted against the number of cell divisions (0 to 50). The distribution is compared at different time points (0, 25, 50, 75 and 100 years). This indicates that changes upon aging are more prominent in the stem cell compartment than in mature cells.