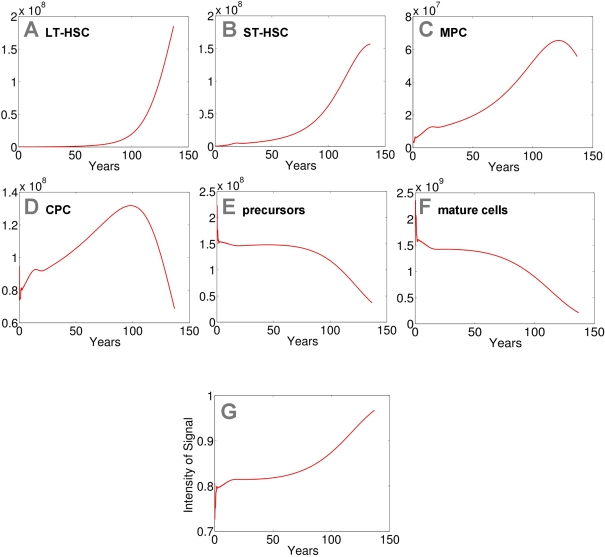
Figure 3.Modeling of replicative senescence in hematopoiesis.
Cell numbers
of the different compartments are plotted over a time course of 140 years
(A: LT-HSC; B: ST-HSC; C: MPC; D: CPC; E: precursors; F: mature cells). The
plots A-F
depict the dynamics of the cells. In addition the progression of the signal
is demonstrated (G).
Input cell numbers were chosen close to the local equilibrium. Our model
demonstrates that, under the assumptions on model parameters, hematopoiesis
can be maintained for more than 100 years with a restriction to 50 cell
divisions. However, the number of mature cells declines over time and the
feedback signal increases correspondingly. Therefore the percentage of
self-renewal increases resulting in a higher number of stem cells and
progenitor cells.