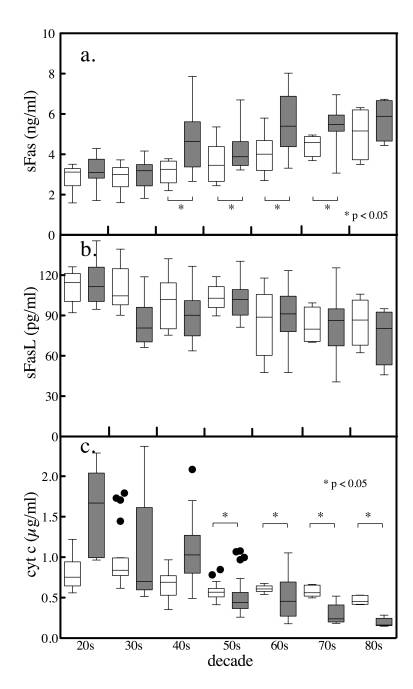
Figure 5.Age and gender differences in serum sFas,. sFasL and total
cytochrome c levels. The serum levels of
the apoptotic biomarkers were segregated by gender and by decade. Tukey box
and whiskers plots (female clear boxes, male shaded boxes) of sFas (a),
sFasL (b) and total cytochrome c
(c) depicting the top, bottom, and line through the middle of the
box correspond to the 75th percentile (top quartile), 25th percentile
(bottom quartile), and 50th percentile (median) respectively. The error
bar-like whiskers depict 1.5 x the interquartile range and the solid
circles represent outliers. Comparisons between genders were performed
conservatively by Mann Whitney U-test.