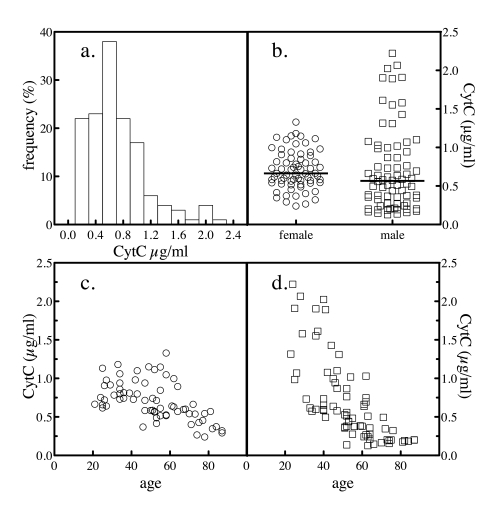
Figure 4.Serum total cytochrome c levels. The levels of
total cytochrome c in 204 normal
subjects were determined as depicted in Figure 3. The frequency
distribution of the values across the subjects was analyzed (a). The
levels of total cytochrome c in all
subjects by gender was plotted (b). The sample population was
segregated by gender and the levels of serum cytochrome
c as a function of donor age for female (c) and male (d)
subjects were plotted.
Figure 4 — Serum markers of apoptosis decrease with age and cancer stage | Aging