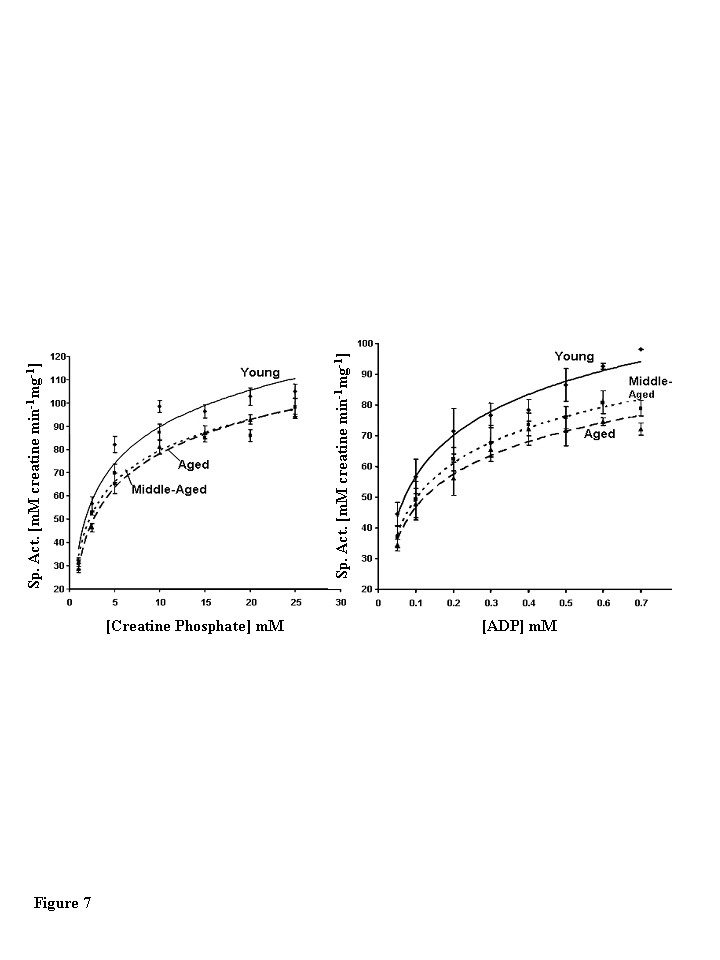
Figure 7.Steady state kinetic analysis of creatine phosphate. (A)
Creatine phosphate and (B) ADP dependence of muscle creatine kinase
purified from young (diamonds, solid line), middle-aged (squares, small
dashed lined), and aged (triangles, large dashed line) mice. The data
presented in the figure are the average of four independent experiments for
creatine phosphate and three independent experiments for ADP. Nonlinear
least squares regression analysis was used to plot best fit curves through
the data. Error bars represent the standard error of mean calculated for
each data point.