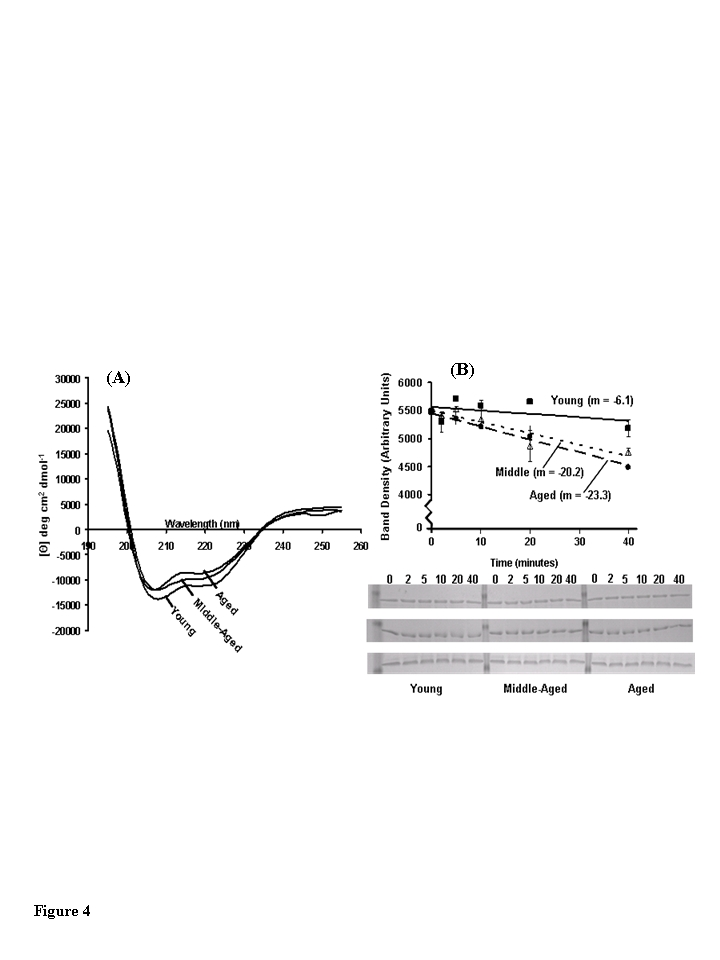
Figure 4.Structural analysis of muscle creatine kinase (CKm) purified from differently aged mouse quadriceps. (A) Far-UV CD spectra of CKm purified from
young, middle-aged and aged mice. All CD experiments were conducted at 25
˚C in 5 mM sodium phosphate buffer (pH 7.2) using hydroxyapatite
purified CKm (>95% pure) at a protein concentration equal to 10 μM. (B)
Limited chymotrypsin digestion of CKm purified from young, middle-aged and
aged mice. Chymotrypsin was added to each sample and the reaction was
quenched at 2, 5, 10, 20 and 40 minutes. Undigested CKm was used as the 0
minute time point. Time courses of proteolysis were constructed by
resolving time points by SDS PAGE and staining gels with Coomassie blue.
The abundance of undigested CKm was quantitated at each time point by
performing densitometry on the 45 kDa band that corresponded to undigested
CKm. Proteolysis experiments were repeated in triplicate and average
density values were plotted versus reaction time. Linear regression
analysis was used to plot best fit lines through the data and the slopes of
these curves are given on the figure. Error bars represented standard error
of mean calculated for each plotted value.