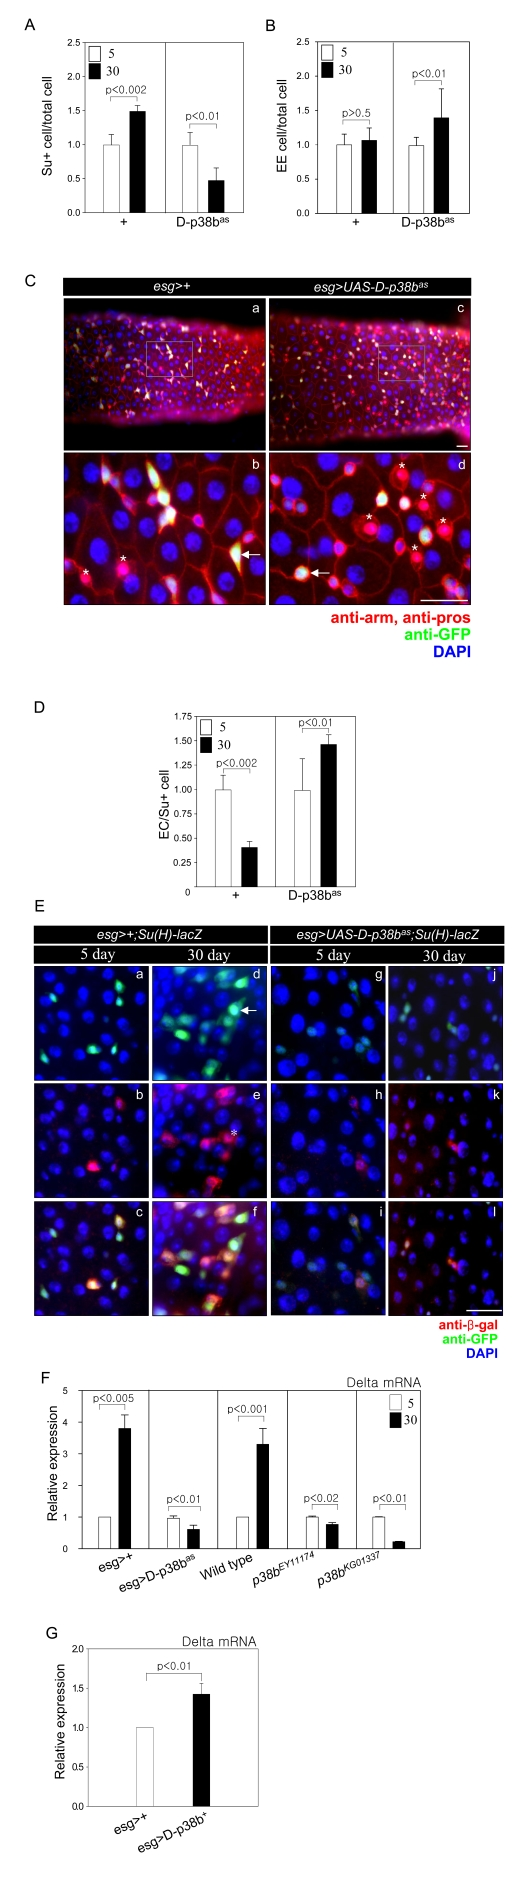
Figure 4.D-p38b MAPK plays a role in age-related defects in the differentiation of ISCs and progenitor cells. (A) Graph showing the ratio of
Su(H)GBE-positive to total cells. Effects of D-p38b activity on age-related
changes in the number of Su(H)GBE-positive cells in the posterior midgut.
Midguts of esg>+;Su(H)GBE-lacZ or esg>UAS-D-p38bas;Su(H)GBE-lacZ
flies were stained with DAPI, anti-β-gal and anti-GFP. The numbers of
each cell type were counted in a 0.06 x 0.04 cm area of the
posterior midgut. The ratio of Su(H)GBE-positive to total cells counted in
the posterior midgut of 5-day-old flies was set as 1. White square,
5-day-old flies; black square, 30-day-old flies. P-values were determined
using Student's t-test. (B) Graph showing the ratio of EE to total
cells. Midguts of esg>+;Su(H)GBE-lacZ or esg>UAS-D-p38bas;Su(H)GBE-lacZ
flies were stained with DAPI, anti-Prospero and anti-GFP. Numbers of each
cell type were counted in a 0.06 x 0.04 cm area of posterior midgut.
The ratio of EE to total cells counted in the posterior midgut of 5-day-old
flies was set as 1. White square, 5-day-old flies; black square, 30-day-old
flies. P-values were determined using Student's t-test. (C) Effects
of D-p38bas expression on ISC and EB cell morphology of
esg-positive cells and differentiation of EEs. Midguts of esg>+
(a-b) or esg>UAS-D-p38bas (c-d) flies were stained with
anti-Prospero (red), anti-GFP (green) and DAPI (blue). Enlarged images,
panels b and d. Scale bar, 5 μM. Arrow heads indicate esg-positive
cells. Asterisks indicate EEs.
(D) Graph showing the ratio of
EC to Su(H)GBE-positive cells. Midguts of esg>+; Su(H)GBE-lacZ or
esg>UAS-D-p38bas; Su(H)GBE-lacZ flies were stained
with DAPI, anti-β-gal and anti-GFP. Numbers of each cell type were
counted in a 0.06 x 0.04 cm area of posterior midgut. The ratio of
EC to Su(H)GBE-positive cells counted in the posterior midgut of 5-day-old
flies was set as 1. White square, 5-day-old flies; black square, 30-day-old
flies. P-values were determined using Student's t-test. (E) Effect
of D-p38bas expression in ISCs and EBs on age-related
accumulation of EC-like large esg- and Su(H)GBE-positive cells. The guts of
5- and 30-day-old flies were labeled with anti-β-gal and anti-GFP.
(a-f) esg>+;Su(H)GBE-lacZ, (g-l) esg>UAS-D-p38bas;Su(H)GBE-lacZ,
(m-r) esg>UAS-D-p38b+; Su(H)GBE-lacZ. (a, d, g, j, m,
and p - green) anti-GFP; (b, e, h, k, n, and q - red) anti-β-gal; (c,
f, I, l, o, and r) merged image. (DAPI, blue). Arrow indicates EC-like
large esg-GAL4. Asterisk indicates large Su(H)GBE-positive cell. Scale bar,
5 μM. (F)
Effect of D-p38b activity on the expression levels of Delta mRNA ISCs and
EBs in adult guts. Delta mRNA was measured by quantitative RT-PCR in cDNA
prepared from dissected guts from 5- and 30-day-old esg>+, esg>UAS-D-p38bas,
wild-type, p38bEY11174, or p38bKG01337 flies.
Expression was normalized to the expression of rp49. Expression level of
Delta mRNA in the midgut of 5-day-old flies was set as 1. White bar,
5-day-old flies; black bar, 30-day-old flies. P-values were determined
using Student's t-test. (G) Effect of D-p38b+ on the
expression of Delta in ISCs and EBs in adult gut. The level of Delta mRNA
was measured by real-time RT-PCR in cDNA prepared from dissected gut from
5-day-old esg>+ or esg>UAS-D-p38b+ flies.
Expression was normalized to the expression of rp49. Expression level of
Delta mRNA in midgut of 5-day-old flies was set as 1. White bar, esg>+;
black bar, esg>UAS-D-p38b+. P-value was determined
using Student's t-test.