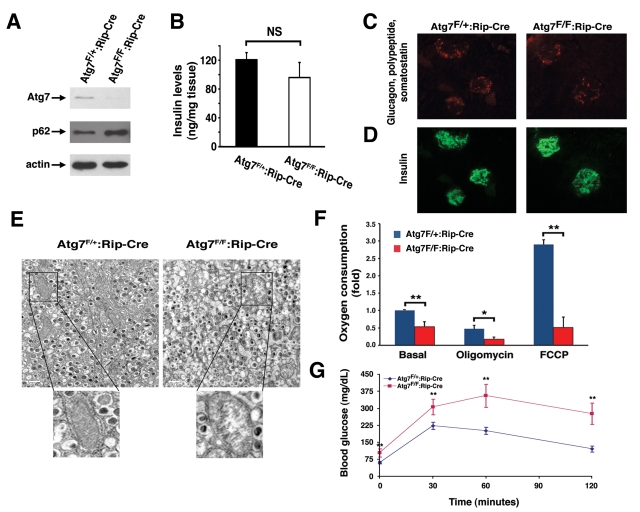
Figure 5.Mice deficient in Atg7 expression within pancreatic β cells demonstrate altered mitochondria. (A) Western blot analysis of purified
pancreatic islets obtained from Atg7F/+:Rip2-CRE or Atg7F/F:Rip2-CRE
mice demonstrating the relative expression of Atg7, p62 and actin (loading
control). (B) Intracellular insulin levels (mean +/- SEM) in
pancreatic tissue of 8-9 week old Atg7F/+:Rip2-Cre (n=4 mice) or
Atg7F/F:Rip2-Cre mice (n=5 mice). The slight reduction in
insulin levels in the Atg7F/F:Rip2-Cre mice was not significant
when compared to the control. (C) Pancreatic sections of control
Atg7F/+:Rip2-Cre or Atg7F/F:Rip2-Cre mice were
stained for non-β cell components within the islets with the
simultaneous use of anti-glucagon, anti-somatostatin, and anti-polypeptide
antibodies. (D) Serial sections were used to visualize β cells
with an anti-insulin antibody. Eight week old mice lacking autophagy in
β cells have qualitatively similar levels of α, δ, and polypeptide producing cells
within their islets, as well as similar levels of β cells when
compared to control mice. (E) Electron micrographs demonstrating the
accumulation of swollen, dysmorphic mitochondria within the Atg7-deficient
β cells. (F) Isolated islets from control and Atg7-/-
mice were assessed for fold +/- SEM changes in basal respiration (Atg7F/+:Rip2-Cre
isolated islets=1), and for oxygen consumption in the presence of
oligomycin (0.5 μM) or FCCP (0.5 μM). Results are normalized to islet
protein concentration and are from n=4 mice per genotype. (G)
Impaired glucose tolerance in Atg7F/F:Rip2-Cre mice. Blood
glucose measurements were made in 8-10 week-old control mice Atg7F/+:Rip2-Cre
(n=10 mice) or Atg7F/F:Rip2-Cre mice (n=8 mice) following the
IP injection of D-glucose (1 g/kg). Data represent the mean +/- SEM. *p≤0.05;
**p≤0.01.