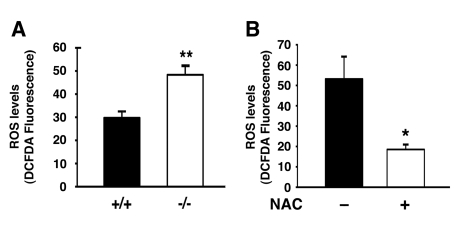
Figure 3.Atg7 deficient cells exhibit increased levels of ROS. (A)
Intracellular ROS levels as assessed by DCFDA fluorescence intensity
(arbitrary units) in WT and Atg7-/- MEFs. ROS measurements were
made from three independent WT or Atg7-/- MEF primary cell
isolates and the fluorescent intensity of more than 250 cells of each
genotype were assessed. (B) NAC treatment reduces the levels of ROS
in MEFs lacking Atg7. Levels of ROS were assessed by DCFDA fluorescence in
Atg7-/- MEFs untreated or treated with NAC (500 μM) for 4 days
prior to imaging. Values represent the normalized fluorescent intensity
(arbitrary units) of approximately 300 cells per condition. Graphs
represent the mean +/- SEM.