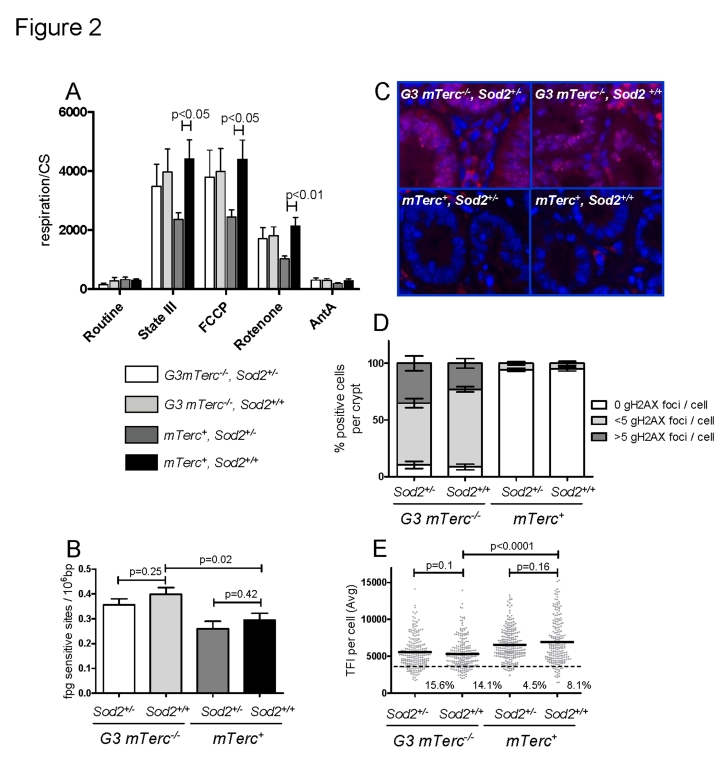
Figure 2.(A)
Mitochondrial respiration of muscle fibers. 10 to 25 mg of permeabilized
bundles were analyzed by high resolution respirometry. Results are
expressed as oxygen consumption per mg of muscle (± SEM) normalized to
citrate synthase activity of n=5 to 6 mice per group. State
III respiration is shown after addition of malate, octanoyl-carnitine, ADP,
glutamate, succinate and cytochrome c. After state III respiration
determination, uncoupled respiration was determined with addition of FCCP
to the respiring fibers. Rotenone and antimycin A were used to inhibit
respiration at complex I and III respectively. (B)
Oxidative modifications (fpg sites) in DNA from bone marrow cells of 12 to
17 month old mice. Data from n=4 to 9 mice per group is shown as number of
lesions per 106 bp ± SEM. (C)
Representative pictures of gH2AX staining in intestinal crypts of
aged mice and bar graphs (D) showing percentage of positive cells
per crypt and number of foci per cell ± SEM of n=4 to 6
mice per group. 200 crypt cells were analyzed per mouse. (E) Telomere length analysis by qFISH in liver
sections of n= 4 to 5 mice per group aged 12 to 18 months old. n=237 G3
mTerc-/-,
Sod2+/-), n=234 (G3 mTerc-/-, Sod2+/+);
n=242 (mTerc+,
Sod2+/-) and n=211 (mTerc+,
Sod2+/+)
nuclei were analyzed for telomere fluorescence intensity (TFI). The black
line indicates the mean TFI value of each genotype and the dotted line the
threshold of critically short telomeres (TFI<3500).