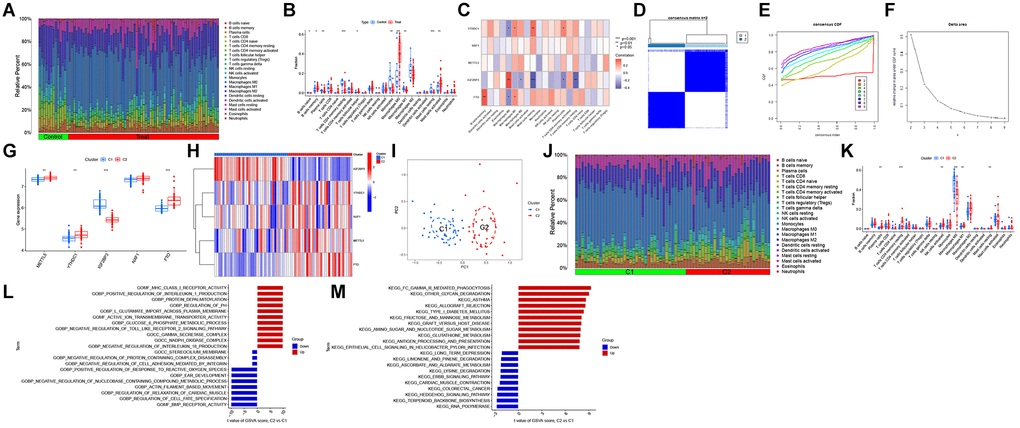
Figure 2.Identification of N6-methyladenosine (m6A)-related molecular clusters in atherosclerosis (AS). (A) The relative abundances of 22 infiltrating immune cells between AS and non-AS controls. (B) Boxplots showing the differential immune cell infiltration levels between AS and non-AS controls. (C) Correlation analysis between five m6A regulators and infiltrating immune cells. (D) Consensus clustering matrix when k = 2. (E) The cumulative distribution function (CDF) curve. (F) The relative change in area under the CDF curve for k = 2–9. (G, H) The differential expression levels of five m6A regulators between two m6A clusters. (I) Principal component analysis (PCA) of cluster 1 and cluster 2. (J) Boxplots showing the differential immune cell infiltration levels between AS and non-AS controls. (K) Differential immune cell infiltration levels between cluster 1 and cluster 2. (L) Differentially enriched biological functions between cluster 1 and cluster 2 were ranked based on the t-value obtained using gene set variation analysis (GSVA). (M) Differentially enriched Kyoto Encyclopedia of Genes and Genomes (KEGG) pathways between cluster 1 and cluster 2 were ranked based on the t-value obtained using GSVA. *p < 0.05, **p < 0.01, ***p < 0.001, ****p < 0.0001.