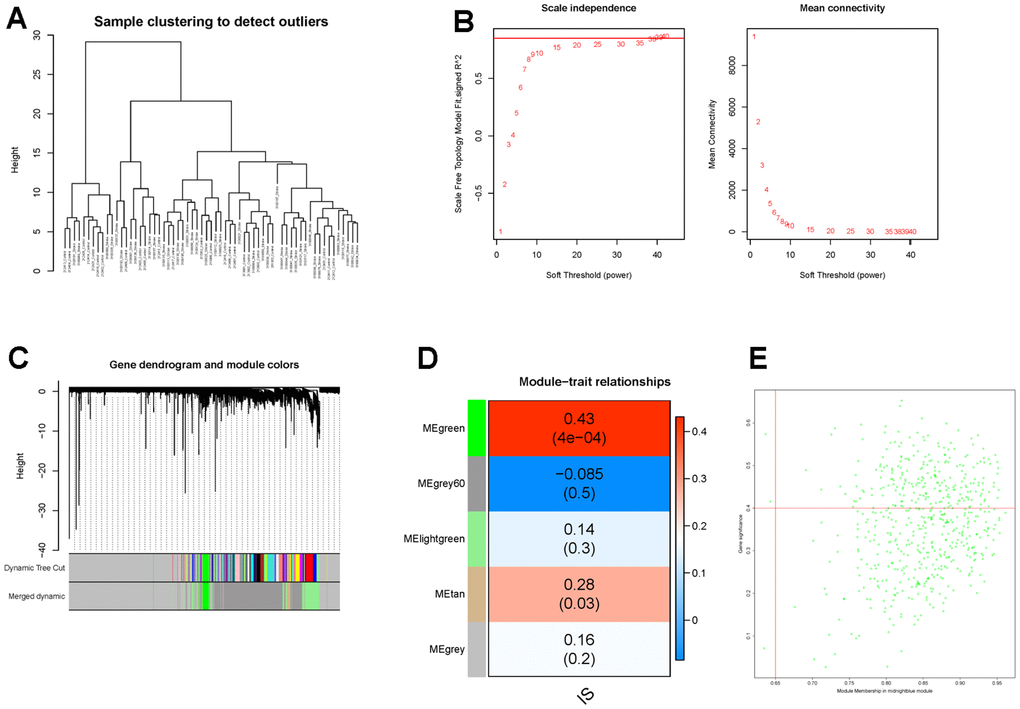
Figure 5.Identification of IS-related genes by WGCNA. (A) The clustering dendrogram of samples shows that samples were well divided into two groups with no outlier. (B) Determination of the soft-threshold to achieve the scale-free network. The left panel shows the influence of soft-threshold power on the scale-free fit index, and the right panel shows the impact of soft-threshold power on the mean connectivity. (C) Gene dendrogram obtained by hierarchical clustering and modules with different colors assigned by dynamic tree cutting. (D) Heatmap displaying the correlation between modules and IS. Each row correlates to a module eigengene, and each cell includes the corresponding correlation and p-value. (E) The scatterplot of gene significance (GS) versus module membership (MM) in the green module.