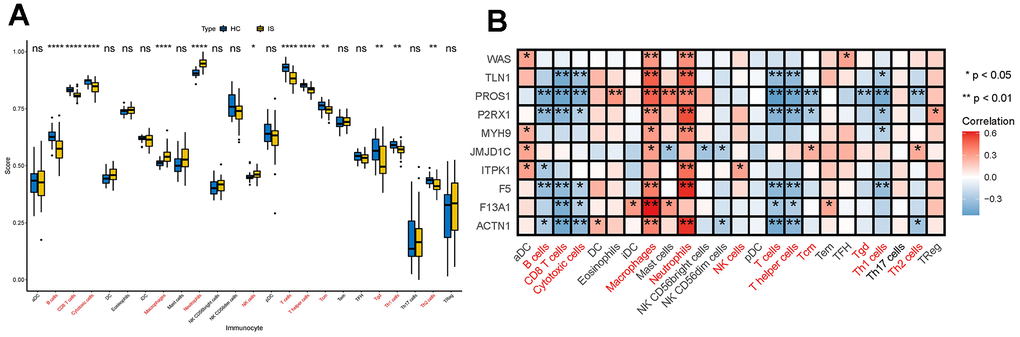
Figure 2.Interactions between DECGs and immune cells. (A) Box plot showing the difference of the proportions of 28 immune cells between IS and HC samples. In the x-axis, the significant differentially infiltrated immune cells were marked in red color. The value shown in the y-axis was the enrichment score of immune cells calculated by ssGSEA. *p <0.05, **p <0.01, ****p <0.0001, nsp > 0.05. (B) Heatmap demonstrating the correlation results between the expressions of DECGs and 28 immune cells. The immune cells in red color at the bottom are significant differentially infiltrated immune cells between IS and HC. The color of each tiny box indicates if they are positive-correlated (red) or negative-correlated (blue). *p <0.05, **p <0.01.