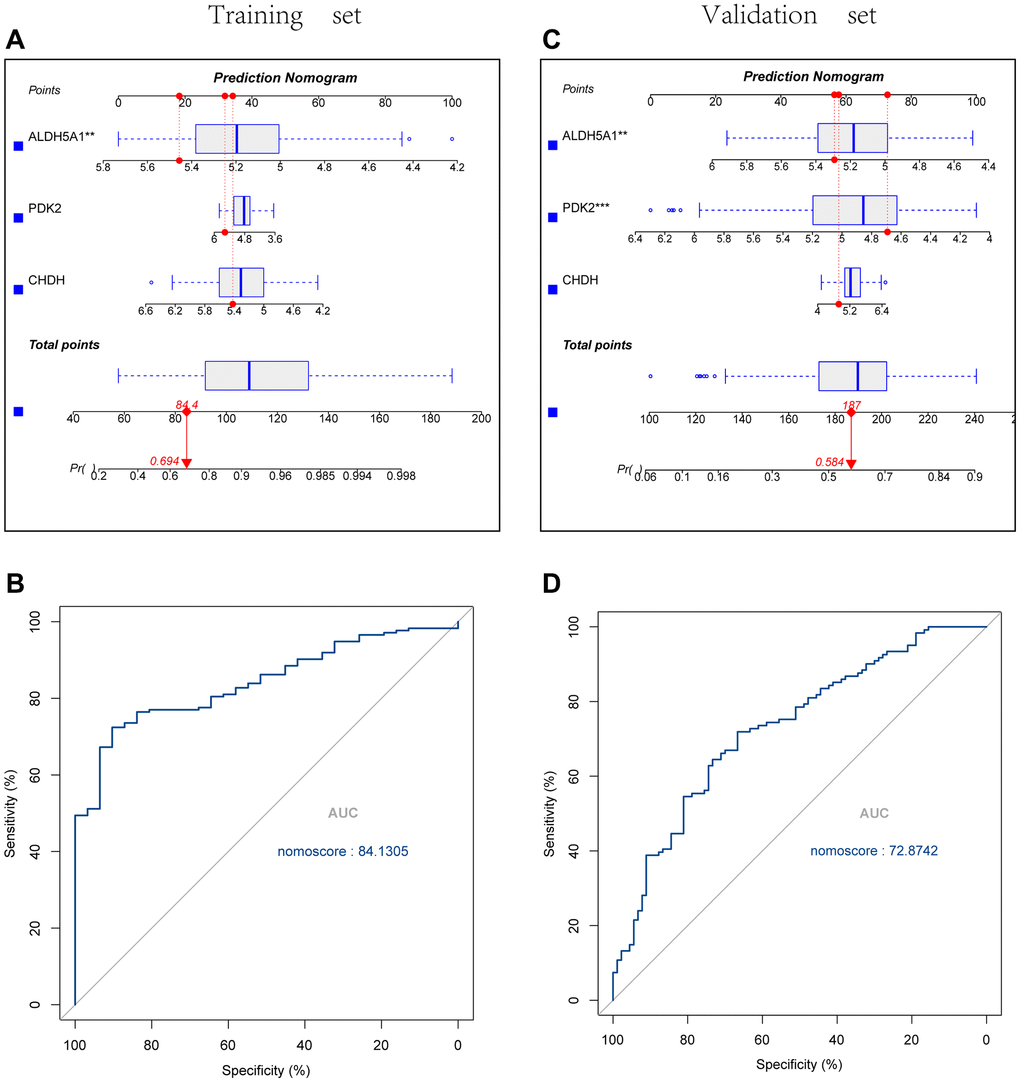
Figure 6.Construction and validation of the UC diagnostic column line graph model. (A, B) Column line graphs are utilized to predict the occurrence of UC in the training and validation cohorts. (C, D) ROC curves were created, with an area under the curve of 84.1305 in the training set and 72.8742 in the validation set.