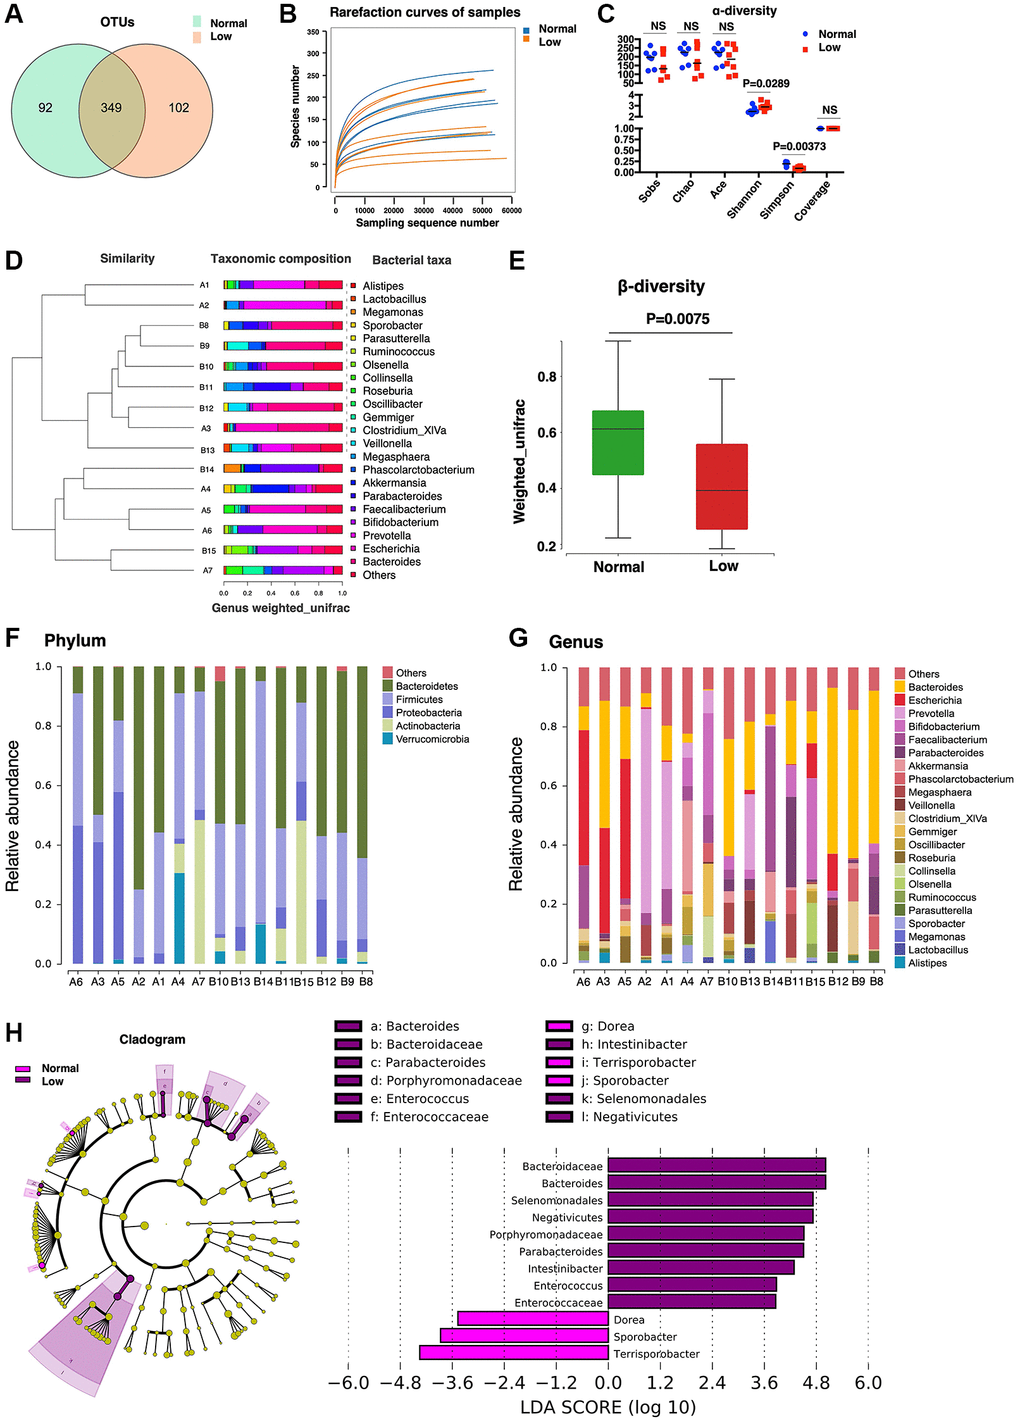
Figure 5.Microbiome analysis. (A) The Core-Pan graph of OTU distribution between the two groups. (B) The rarefaction curve of random sequences per sample and their corresponding number of observed species. (C) Species diversity differences estimated on the basis of the observed Sobs, Chao, Ace, Shannon, Simpson, and Coverage indices. (D) UPGMA cluster analysis of 15 samples at the genus level. A1–A7 represent the normal handgrip strength group; B8–B15 represents the low handgrip strength group. (E) β-diversity box-plot constructed on the basis of Weighted UniFrac analysis between the two groups. (F) The percentages of gut microbiota diversity at the phylum level. (G) The percentages of gut microbiota diversity at the genus level. (H) Linear discriminant analysis (LDA) integrated with effect size (LEfSe). Left: the phylogenetic distribution of microbiota in the Cladogram. Right: the differences in the abundance of microbiota.