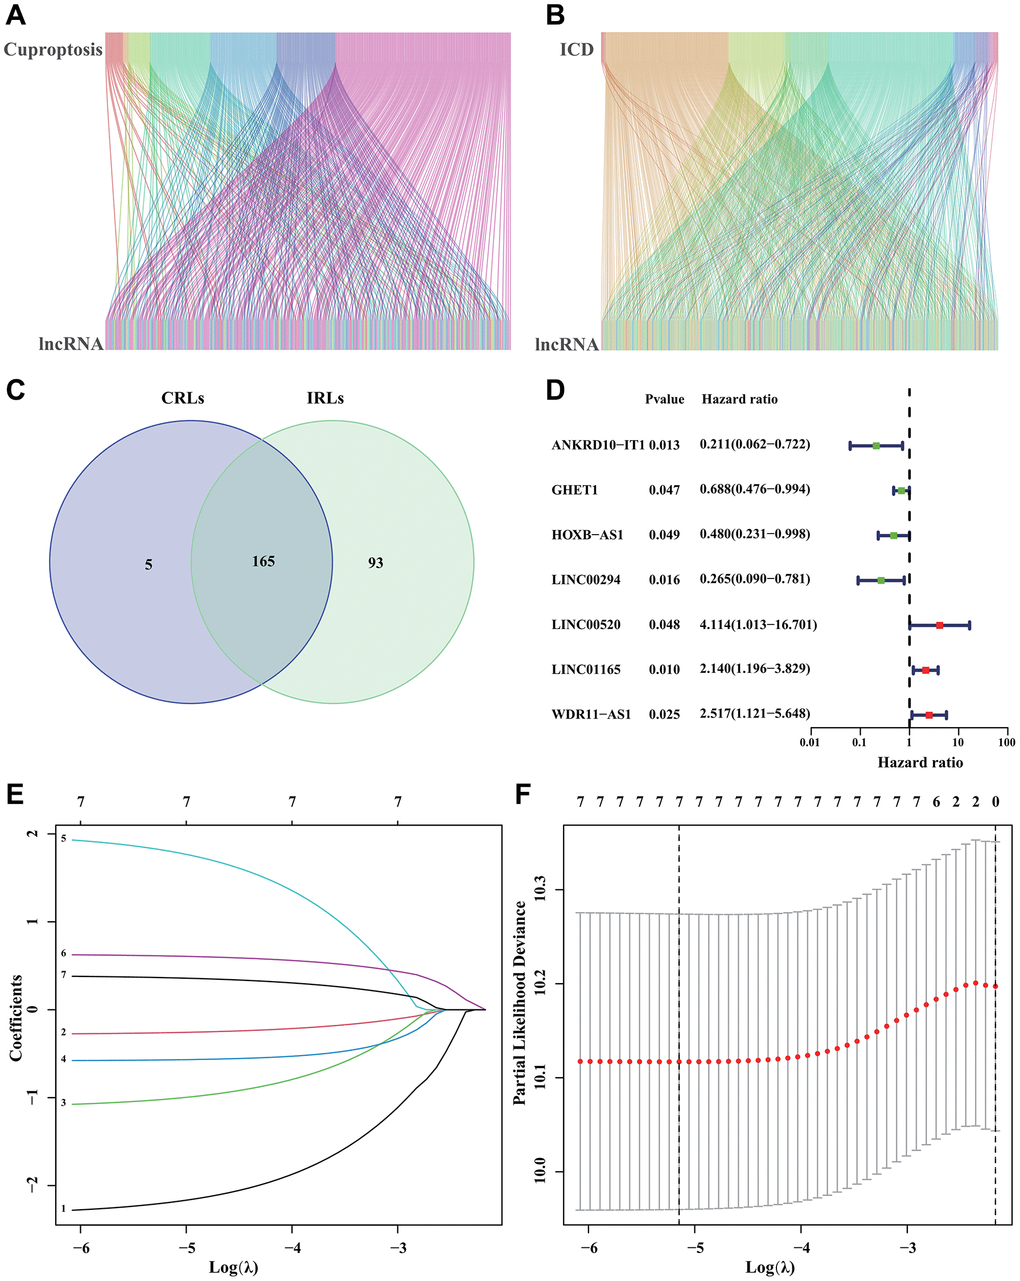
Figure 1.Identification of CRIRLs. (A) Sankey chart illustrating the relationship between CRGs and CRLs. (B) Sankey diagram of relationship between IRGs and IRLs. (C) Venn diagram of CRLs and IRLs. (D) The prognostic CRIRLs were analyzed using univariate Cox regression. (E, F) LASSO regression analysis displays the minimum lambda and optimal coefficients of prognostic CRIRLs.