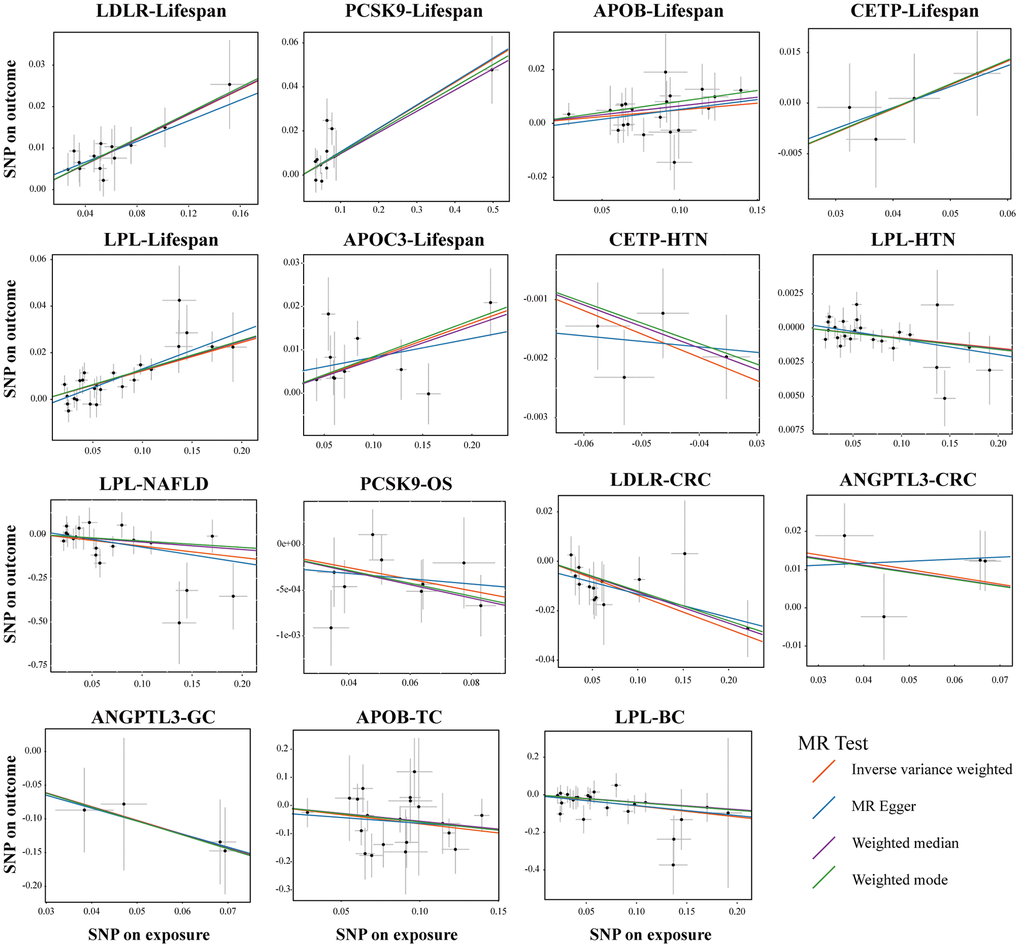
Figure 5.Sensitivity test in drug-target MR analyses. Scatter plots of four statistical tests showing representative lipid-lowering drug target genes that had a causal relationship on the different outcomes. Each black dot represents an SNP significantly associated with lipid-lowering effects. The gray lines around the dot represent the 95% confidence intervals of each SNP. Four lines generated by different MR tests were colored as red (Inverse Variance Weighted, IVW), blue (MR Egger), purple (Weighted Median), and green (Weighted mode). the X-axis represents the SNPs effects of certain lipid-lowering genes, and the Y-axis represents the SNPs effects of different outcomes. Abbreviations: HTN, hypertension; NAFLD, non-alcoholic fatty liver disease; OS, osteoporosis; CRC, colorectal cancer; GC, gastric cancer; TC, thyroid cancer, BC, bladder cancer.