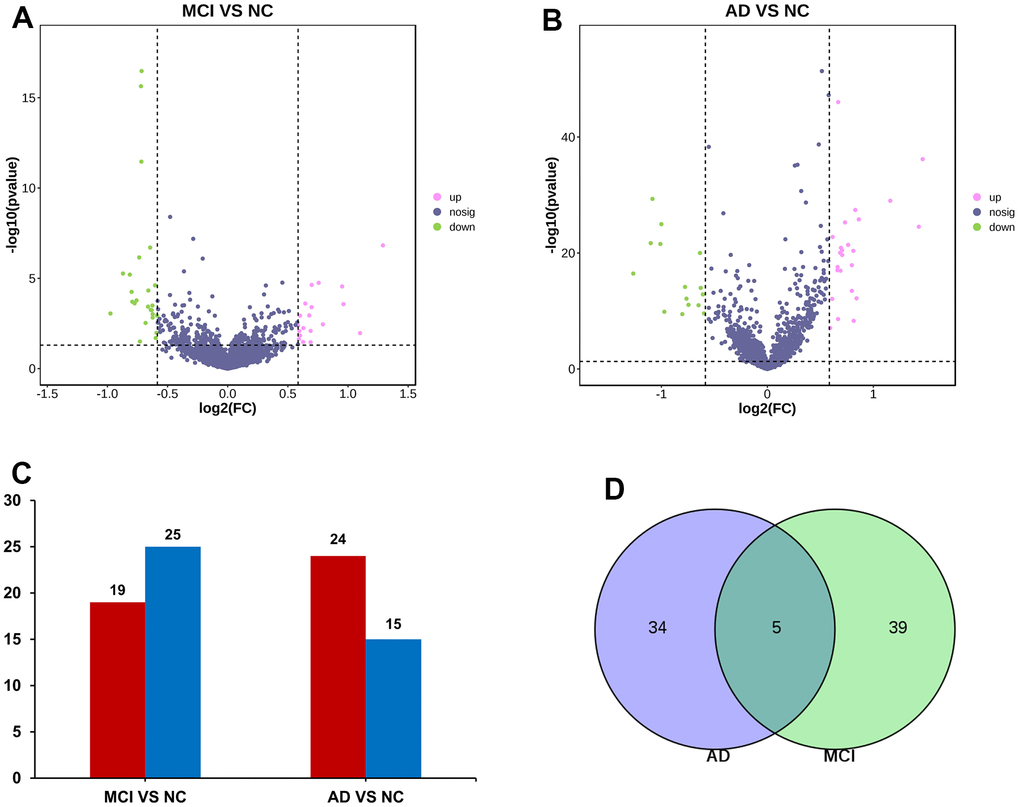
Figure 2.miRNA screening. (A) Volcano maps of miRNA differentially expressed in MCI. Red dots indicate up-regulated genes, P < 0.05, FC > 1.5; Green dots indicate down-regulated genes, P < 0.05, FC < -1.5; Black dots indicate genes with no significant difference in expression. (B) Volcano maps of miRNA differentially expressed in AD. (C) Differential miRNA data statistics. (D) Venn diagram screened miRNAs that were differentially expressed in both MCI and AD groups.