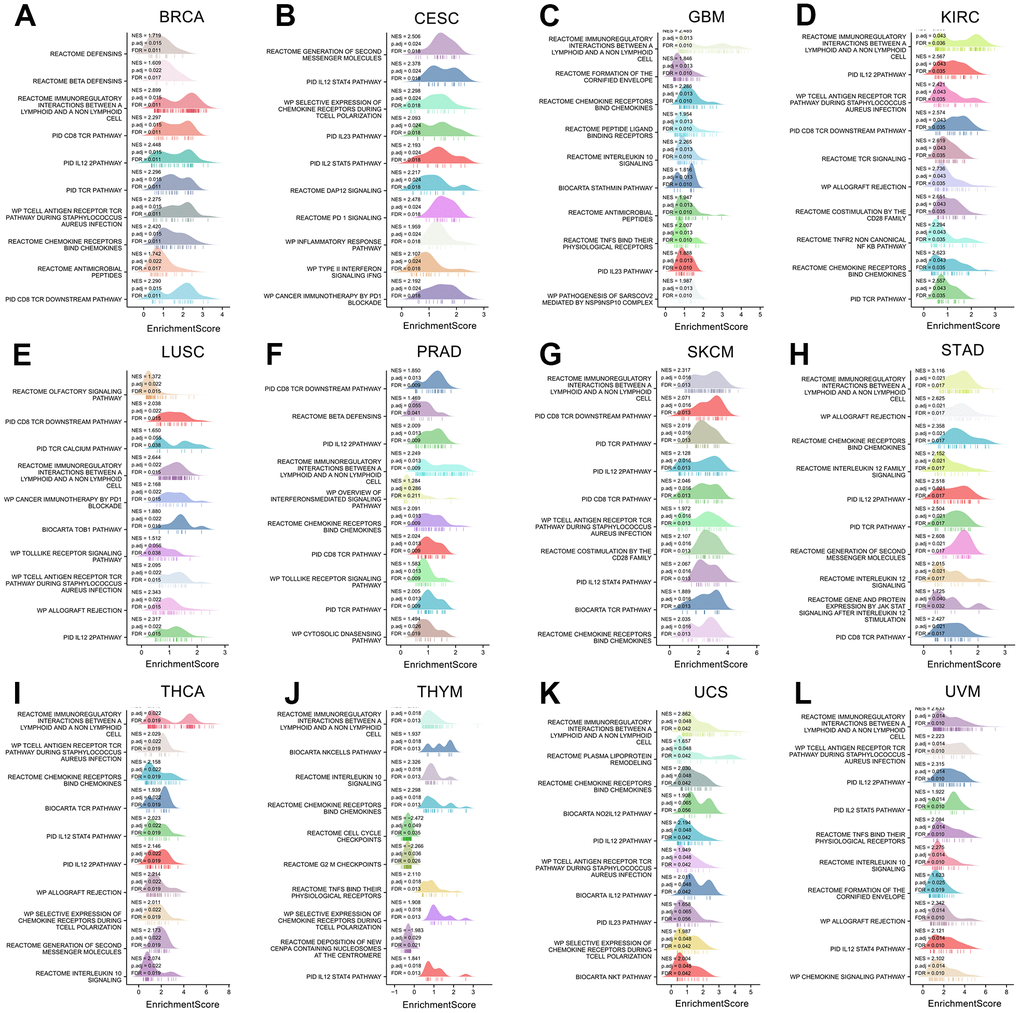
Figure 12.The gene set enrichment analysis of XCL2 in 12 cancers. The top 10 GSEA pathways of XCL2 in (A) BRCA, (B) CESC, (C) GBM, (D) KIRC, (E) LUSC, (F) PRAD, (G) SKCM, (H) STAD, (I) THCA, (J) THYM, (K) UCS, and (L) UVM. The Y-axis represents one gene set, and the X-axis is the distribution of enrichment corresponding to the core molecules in each gene set.