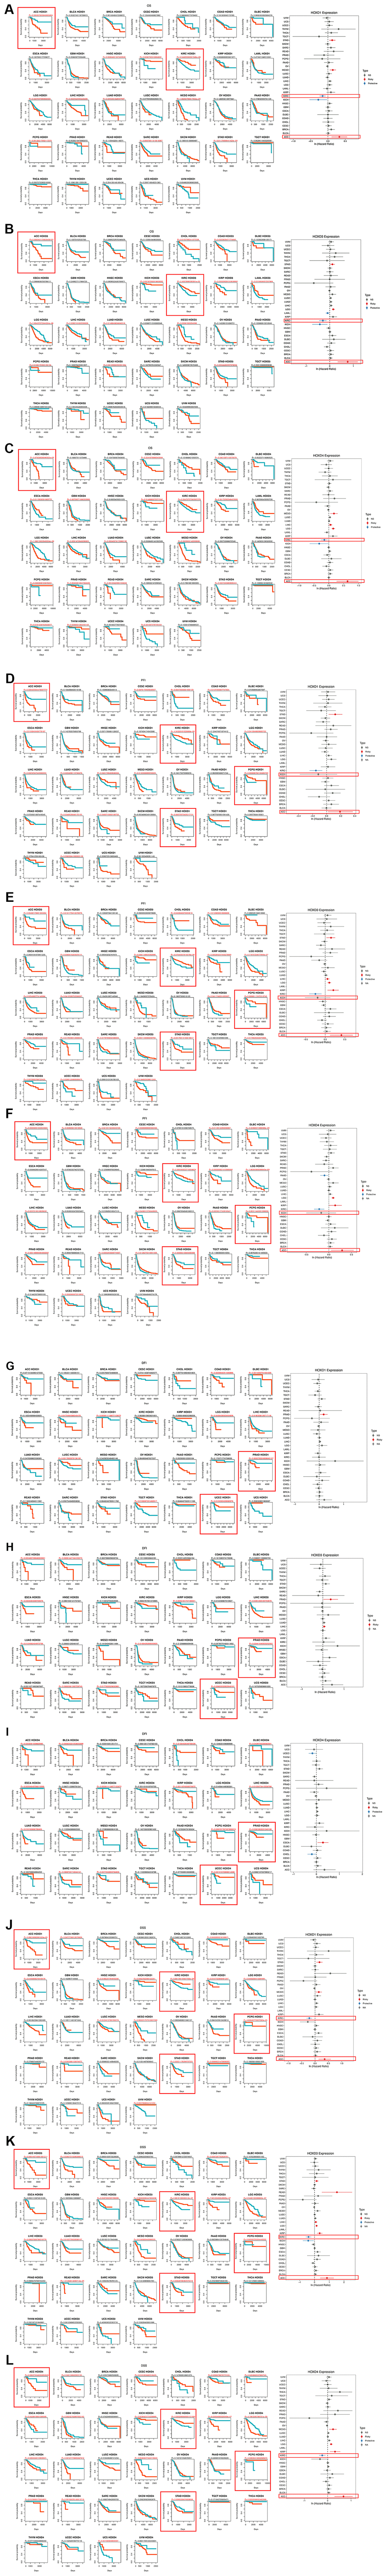
Figure 3.Association between the HOXD1, HOXD3, and HOXD4 expression and the OS, PFI, DFI, and DSS of cancer patients. (A–C) Kaplan-Meier curves showing OS in pan-cancer. Forest plot showing OS after Cox analysis in pan-cancer (right). (D–F) Kaplan-Meier curves showing PFI in pan-cancer. Forest plot showing PFI after Cox analysis in pan-cancer (right). (G–I) Kaplan-Meier curves showing DFI in pan-cancer. Forest plot showing DFI after Cox analysis in pan-cancer (right). (J–L) Kaplan-Meier curves showing DSS in pan-cancer. Forest plot showing DSS after Cox analysis in pan-cancer (right).