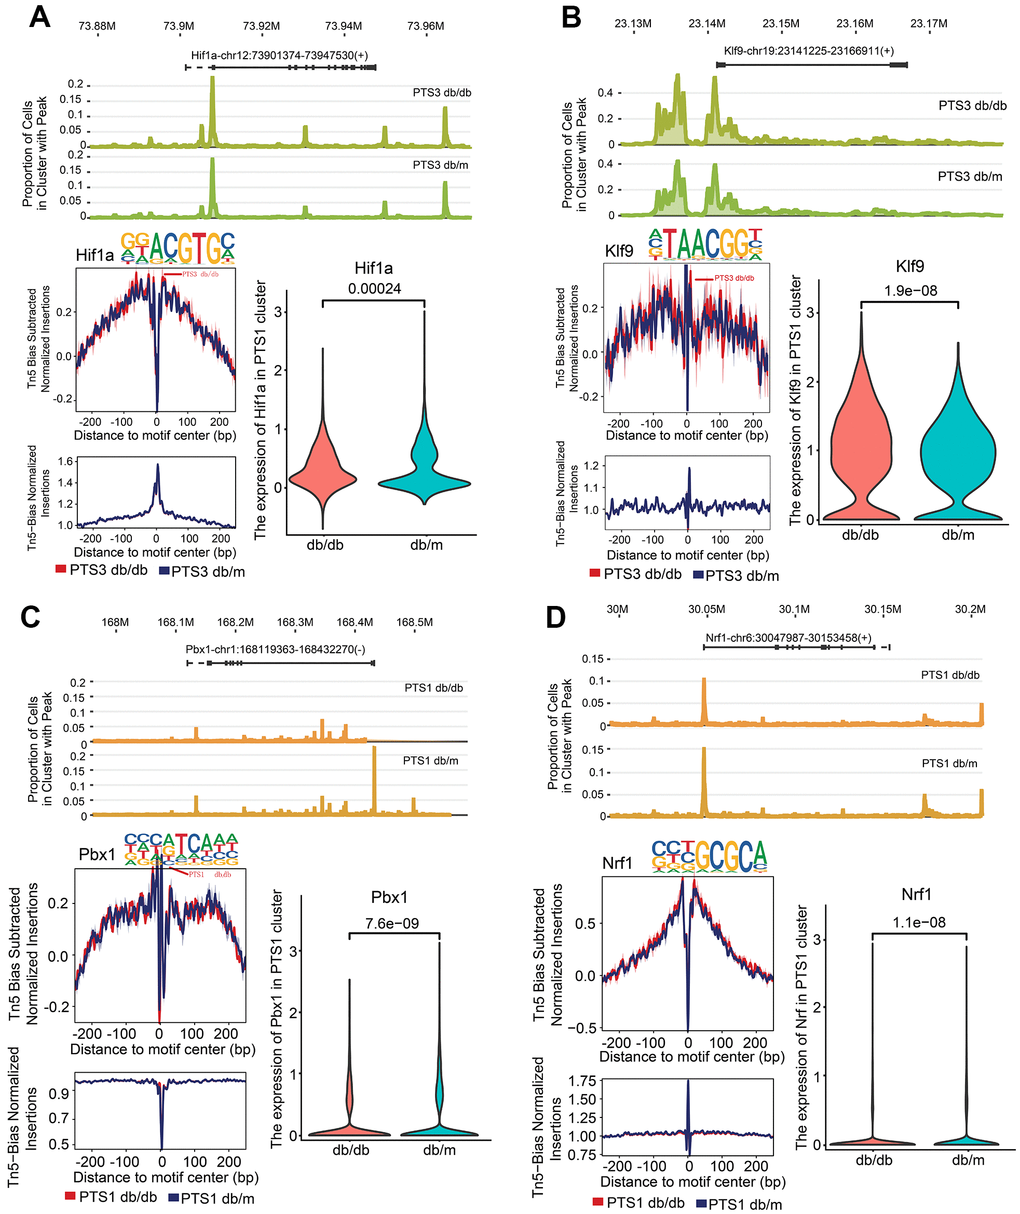
Figure 6.Kidney injury-related transcription factor (TF) analysis in the PTS1 and PTS3 clusters. (A) Peak distribution, footprinting, and expression of Hif1a in the PTS3 cluster of db/db and db/m mice. (B) Peak distribution, footprinting, and expression of Klf9 in the PTS3 cluster of db/db and db/m mice. (C) Peak distribution, footprinting, and expression of Pbx1 in the PTS1 cluster of db/db and db/m mice. (D) Peak distribution, footprinting, and expression of Nrf1 in the PTS1 cluster of db/db and db/m mice.