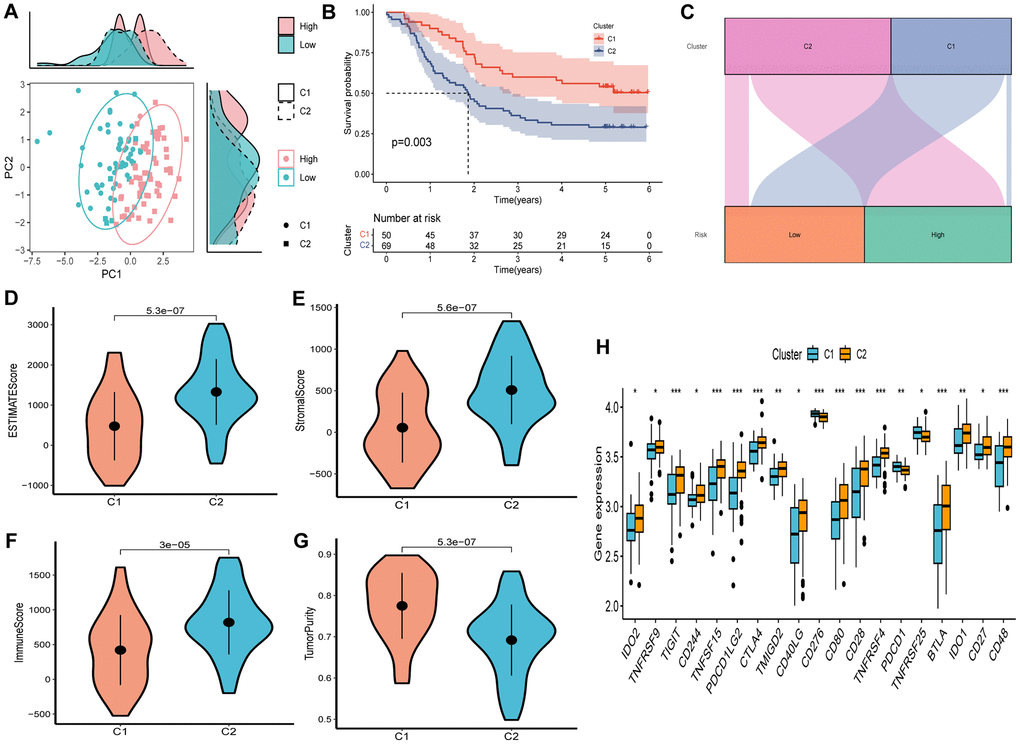
Figure 9.Consensus clustering based on nine prognostic SCRGs expression. (A) PCA depicted the distribution for clusters. (B) Survival analysis based on the two clusters. (C) The Sankey diagram of the connection between clusters and high-and low-risk group. (D) ESTIMATEScore difference between two clusters. (E) SromalScore difference between two clusters. (F) ImmuneScore difference between two clusters. (G) TumorPurity difference between two clusters. (H) Expression difference of immune checkpoints between two clusters. (*P < 0.05; **P < 0.01; ***P < 0.001).