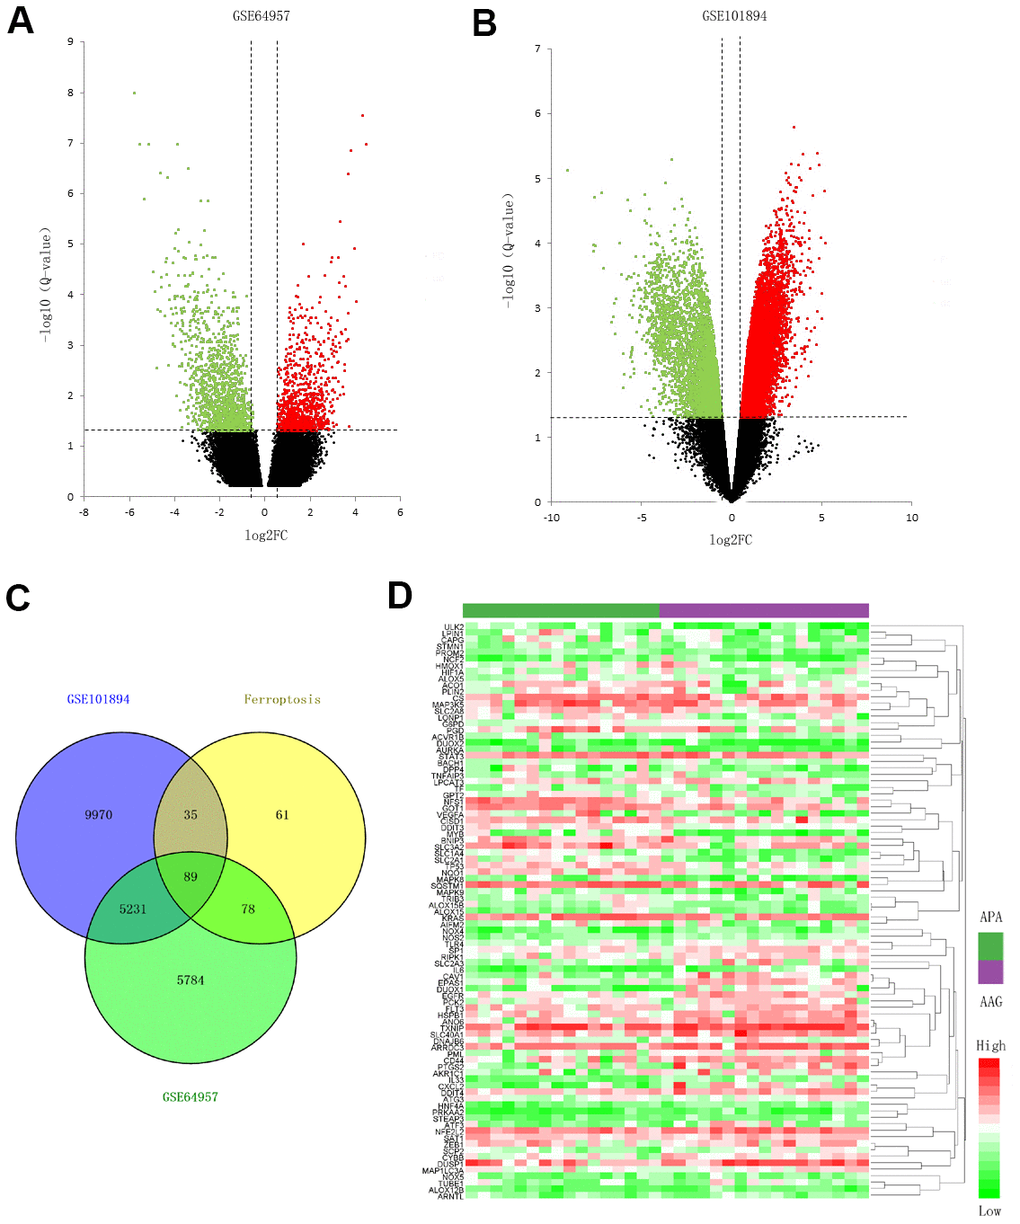
Figure 1.Screening for the ferroptosis-related DEGs. (A, B) Volcano plots of the DEGs in GSE64957 and GSE101894 between APA and AAG tissue. The red dots represent the upregulated genes, the green dots represent the downregulated genes, and the black dots represent genes with no significant difference. (C) Venn diagram to identify ferroptosis-related DEGs. (D) Expression heatmap of 89 ferroptosis-related DEGs in APA and AAG tissue.